Publication
Metrics
AI Quick Summary
This paper presents a three-dimensional extinction map in the $r$ band for the Galactic Anticentre, derived from multi-band photometry and SED fitting of over 30 million stars. The map covers a region with high extinction and low Galactic latitude, providing detailed extinction information for more than 13 million stars.
Paper Preview
Abstract
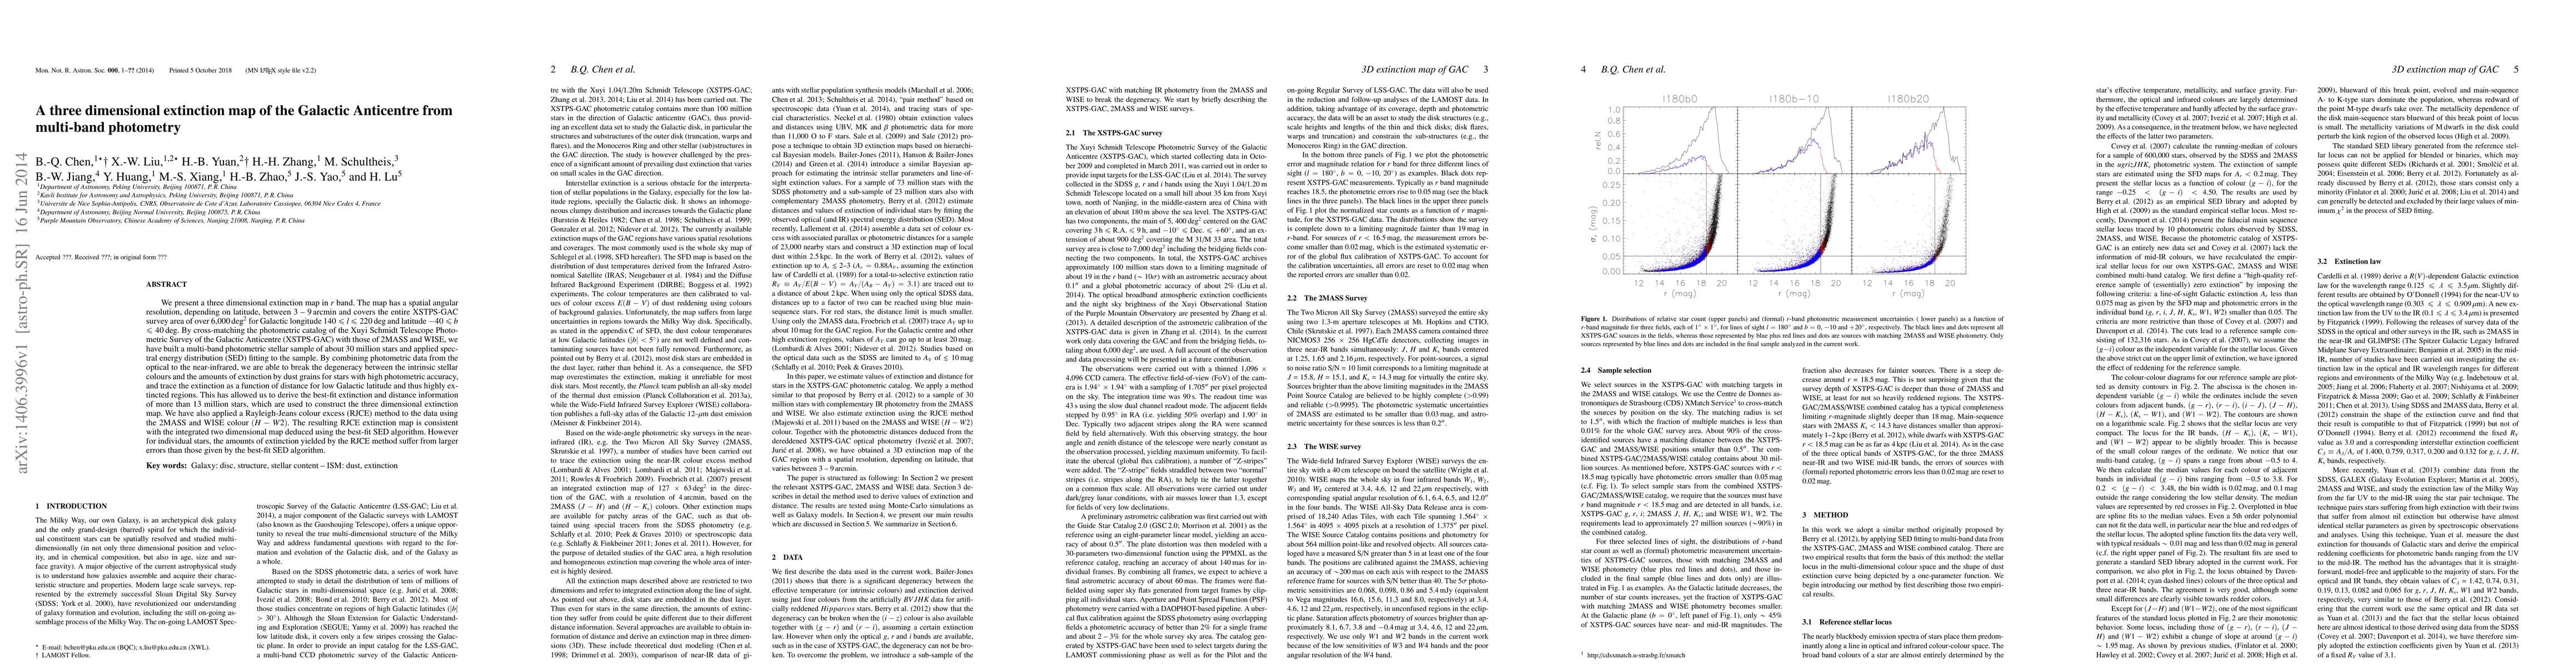
We present a three dimensional extinction map in $r$ band. The map has a spatial angular resolution, depending on latitude, between 3 -- 9\,arcmin and covers the entire XSTPS-GAC survey area of over 6,000\,$\rm deg^2$ for Galactic longitude $\rm 140 \leq$ $l$ $ \leq 220\deg$ and latitude $\rm -40\leq$ $b$ $ \leq 40\deg$. By cross-matching the photometric catalog of the Xuyi Schmidt Telescope Photometric Survey of the Galactic Anticentre (XSTPS-GAC) with those of 2MASS and WISE, we have built a multi-band photometric stellar sample of about 30 million stars and applied spectral energy distribution (SED) fitting to the sample. By combining photometric data from the optical to the near-infrared, we are able to break the degeneracy between the intrinsic stellar colours and the amounts of extinction by dust grains for stars with high photometric accuracy, and trace the extinction as a function of distance for low Galactic latitude and thus highly extincted regions. This has allowed us to derive the best-fit extinction and distance information of more than 13 million stars, which are used to construct the three dimensional extinction map. We have also applied a Rayleigh-Jeans colour excess (RJCE) method to the data using the 2MASS and WISE colour $(H-W2)$. The resulting RJCE extinction map is consistent with the integrated two dimensional map deduced using the best-fit SED algorithm. However for individual stars, the amounts of extinction yielded by the RJCE method suffer from larger errors than those given by the best-fit SED algorithm.
AI Key Findings
Get AI-generated insights about this paper's methodology, results, significance, and more — seven facets brought into focus.
Impact
Paper Details
PDF Preview
Key Terms
Citation Network
Current paper (gray), citations (green), references (blue)
Display is limited for performance on very large graphs.
Discussion 0