A three-point velocity estimation method for turbulent flows in two spatial dimensions
Publication
Metrics
AI Quick Summary
This paper introduces a three-point velocity estimation method for turbulent flows in two dimensions, demonstrating its superiority over the standard two-point method by accurately estimating velocity components using non-aligned measurement points. The method is validated through synthetic data and applied to plasma fluctuation data from the Alcator C-Mod tokamak.
Paper Preview
Abstract
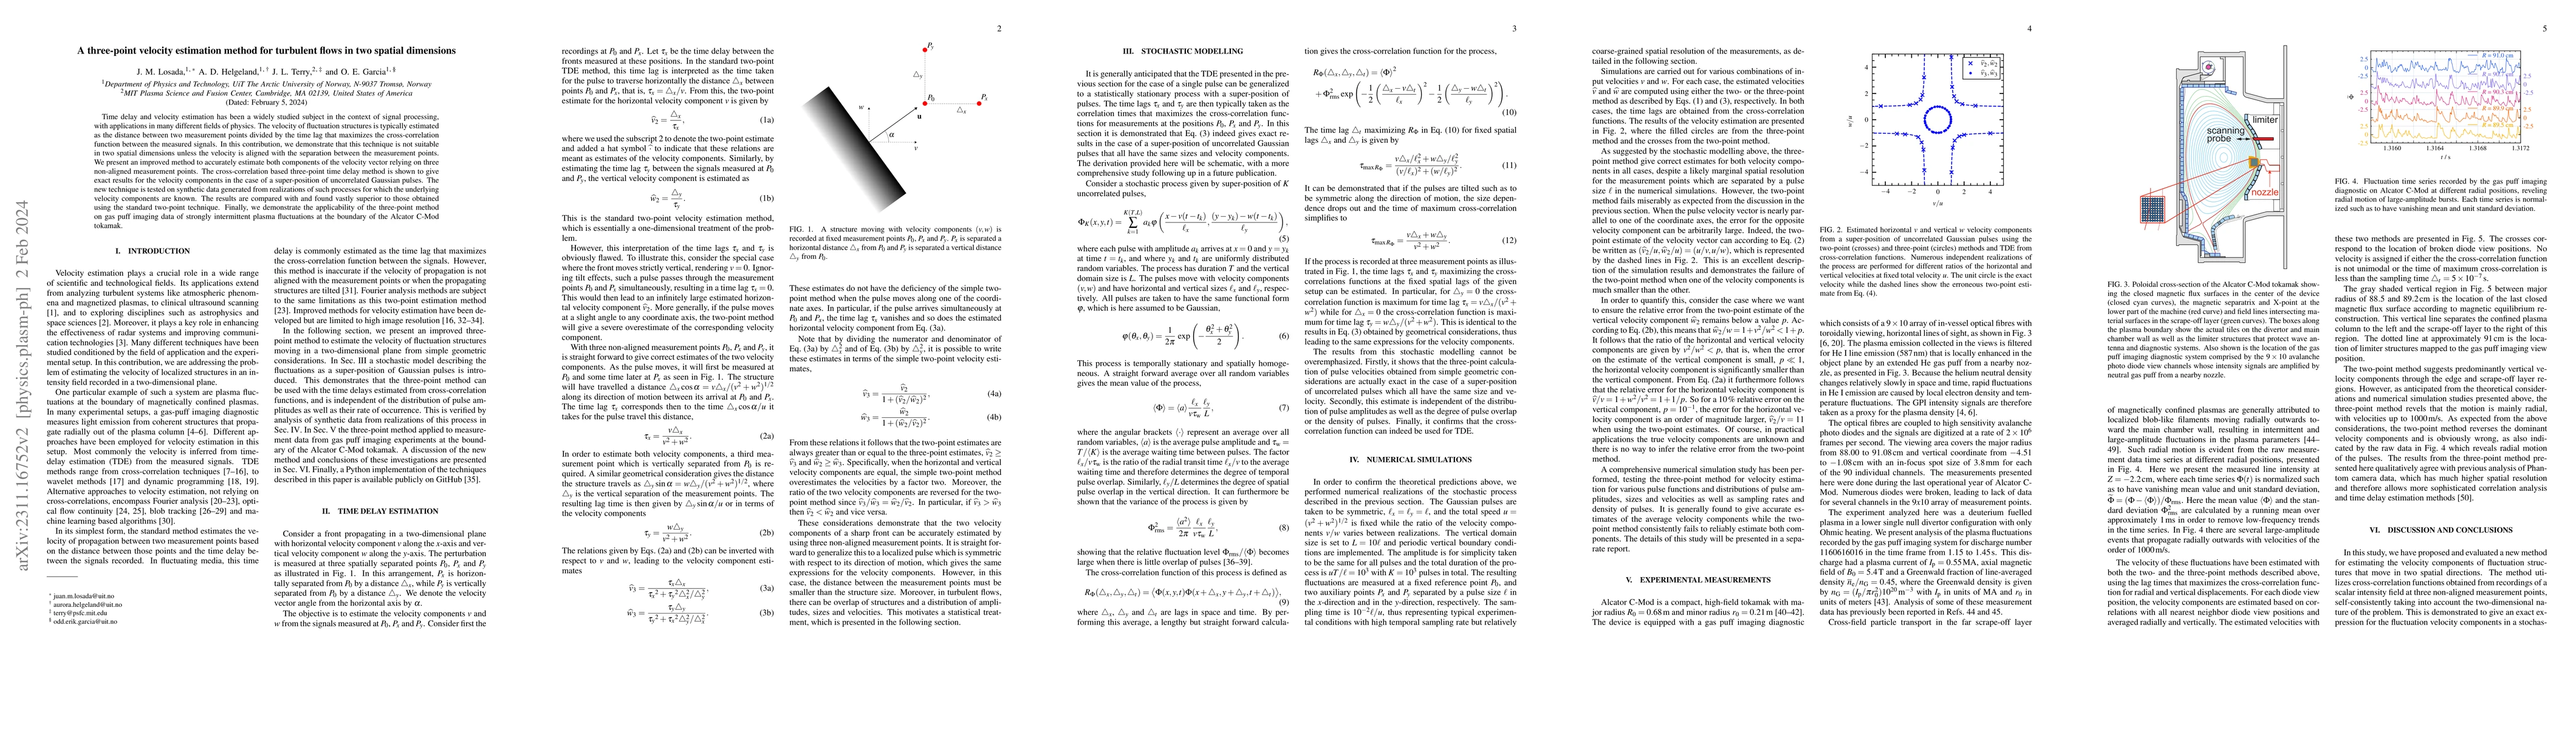
Time delay and velocity estimation has been a widely studied subject in the context of signal processing, with applications in many different fields of physics. The velocity of fluctuation structures is typically estimated as the distance between two measurement points divided by the time lag that maximizes the cross-correlation function between the measured signals. In this contribution, we demonstrate that this technique is not suitable in two spatial dimensions unless the velocity is aligned with the separation between the measurement points. We present an improved method to accurately estimate both components of the velocity vector relying on three non-aligned measurement points. The cross-correlation based three-point time delay method is shown to give exact results for the velocity components in the case of a super-position of uncorrelated Gaussian pulses. The new technique is tested on synthetic data generated from realizations of such processes for which the underlying velocity components are known. The results are compared with and found vastly superior to those obtained using the standard two-point technique. Finally, we demonstrate the applicability of the three-point method on gas puff imaging data of strongly intermittent plasma fluctuations at the boundary of the Alcator C-Mod tokamak.
AI Key Findings
Get AI-generated insights about this paper's methodology, results, significance, and more — seven facets brought into focus.
Paper Details
Authors
PDF Preview
Key Terms
Related Papers
No references found for this paper.
Discussion 0