Publication
Metrics
AI Quick Summary
This paper presents a real U.S. distribution grid model with smart meters, providing a comprehensive and representative test system for time-series distribution analysis. It includes overhead lines, underground cables, and standard grid components, uniquely offering one-year smart meter measurements at all nodes.
Paper Preview
Abstract
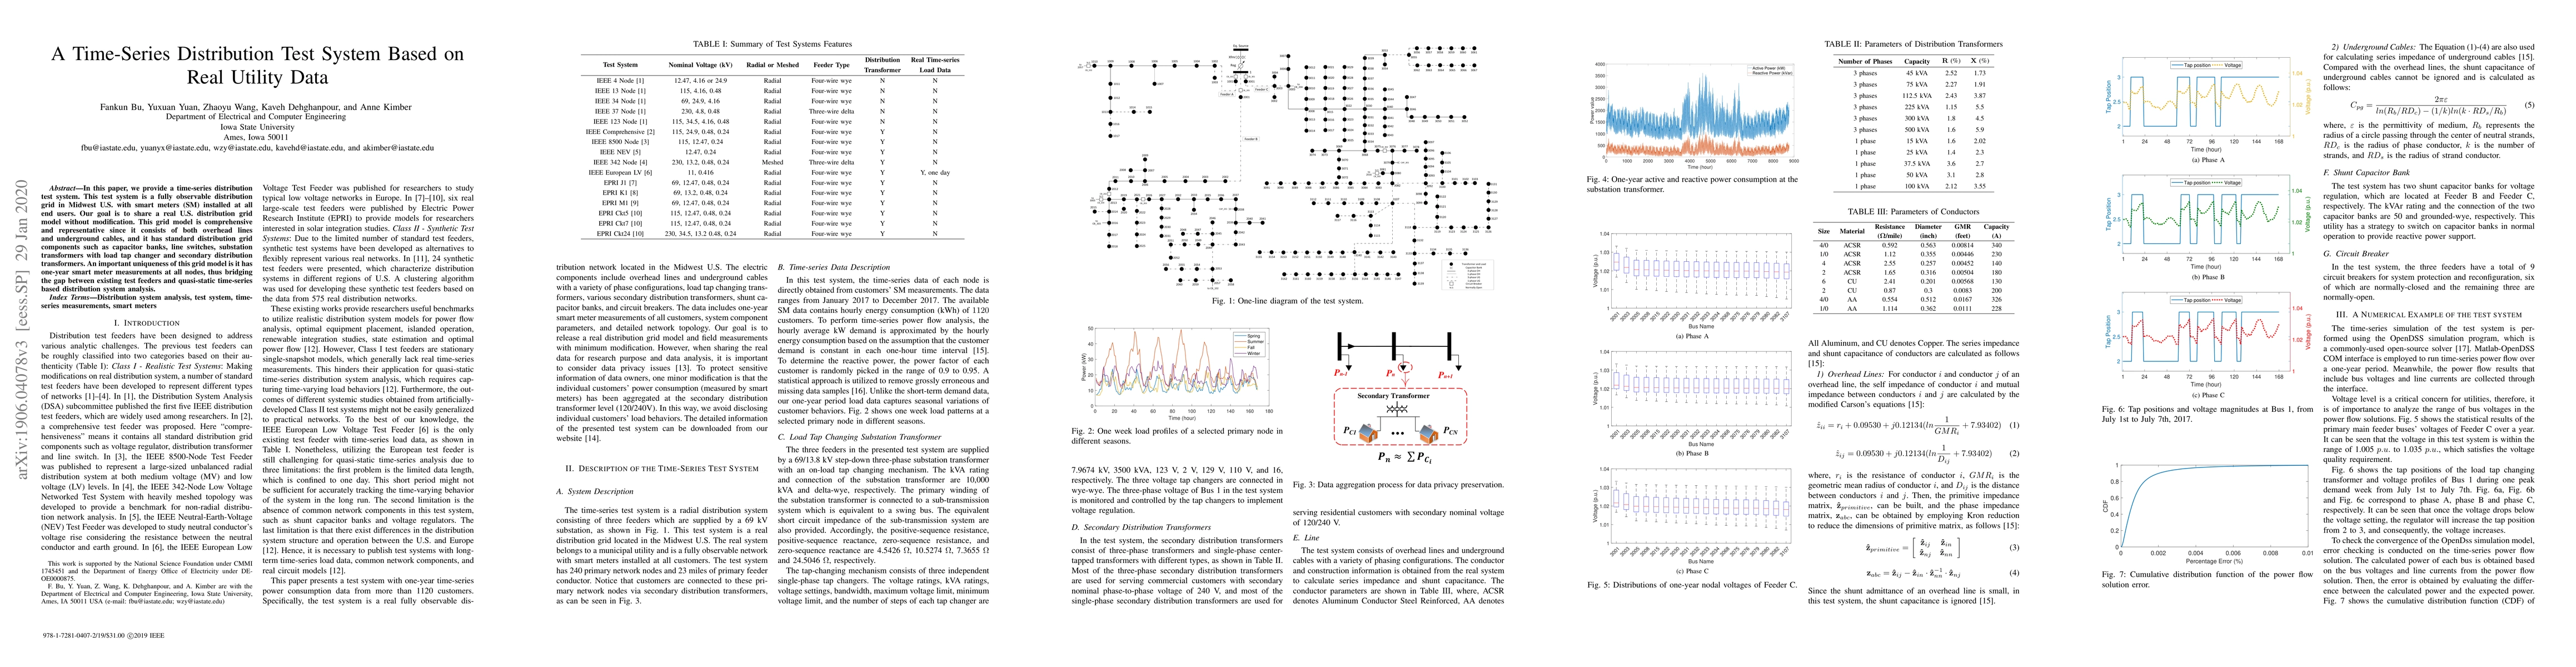
In this paper, we provide a time-series distribution test system. This test system is a fully observable distribution grid in Midwest U.S. with smart meters (SM) installed at all end users. Our goal is to share a real U.S. distribution grid model without modification. This grid model is comprehensive and representative since it consists of both overhead lines and underground cables, and it has standard distribution grid components such as capacitor banks, line switches, substation transformers with load tap changer and secondary distribution transformers. An important uniqueness of this grid model is it has one-year smart meter measurements at all nodes, thus bridging the gap between existing test feeders and quasi-static time-series based distribution system analysis.
AI Key Findings
Get AI-generated insights about this paper's methodology, results, significance, and more — seven facets brought into focus.
Impact
Paper Details
Authors
PDF Preview
Key Terms
Citation Network
Current paper (gray), citations (green), references (blue)
Display is limited for performance on very large graphs.
Discussion 0