Publication
Metrics
AI Quick Summary
This paper provides a comprehensive tutorial on calculating sample sizes and power for detecting treatment effect heterogeneity in cluster randomized trials (CRTs). It consolidates existing methods and presents an online R Shiny calculator for practical application, emphasizing the importance of pre-specified effect modifiers and intracluster correlation coefficients in ensuring adequate statistical power.
Paper Preview
Abstract
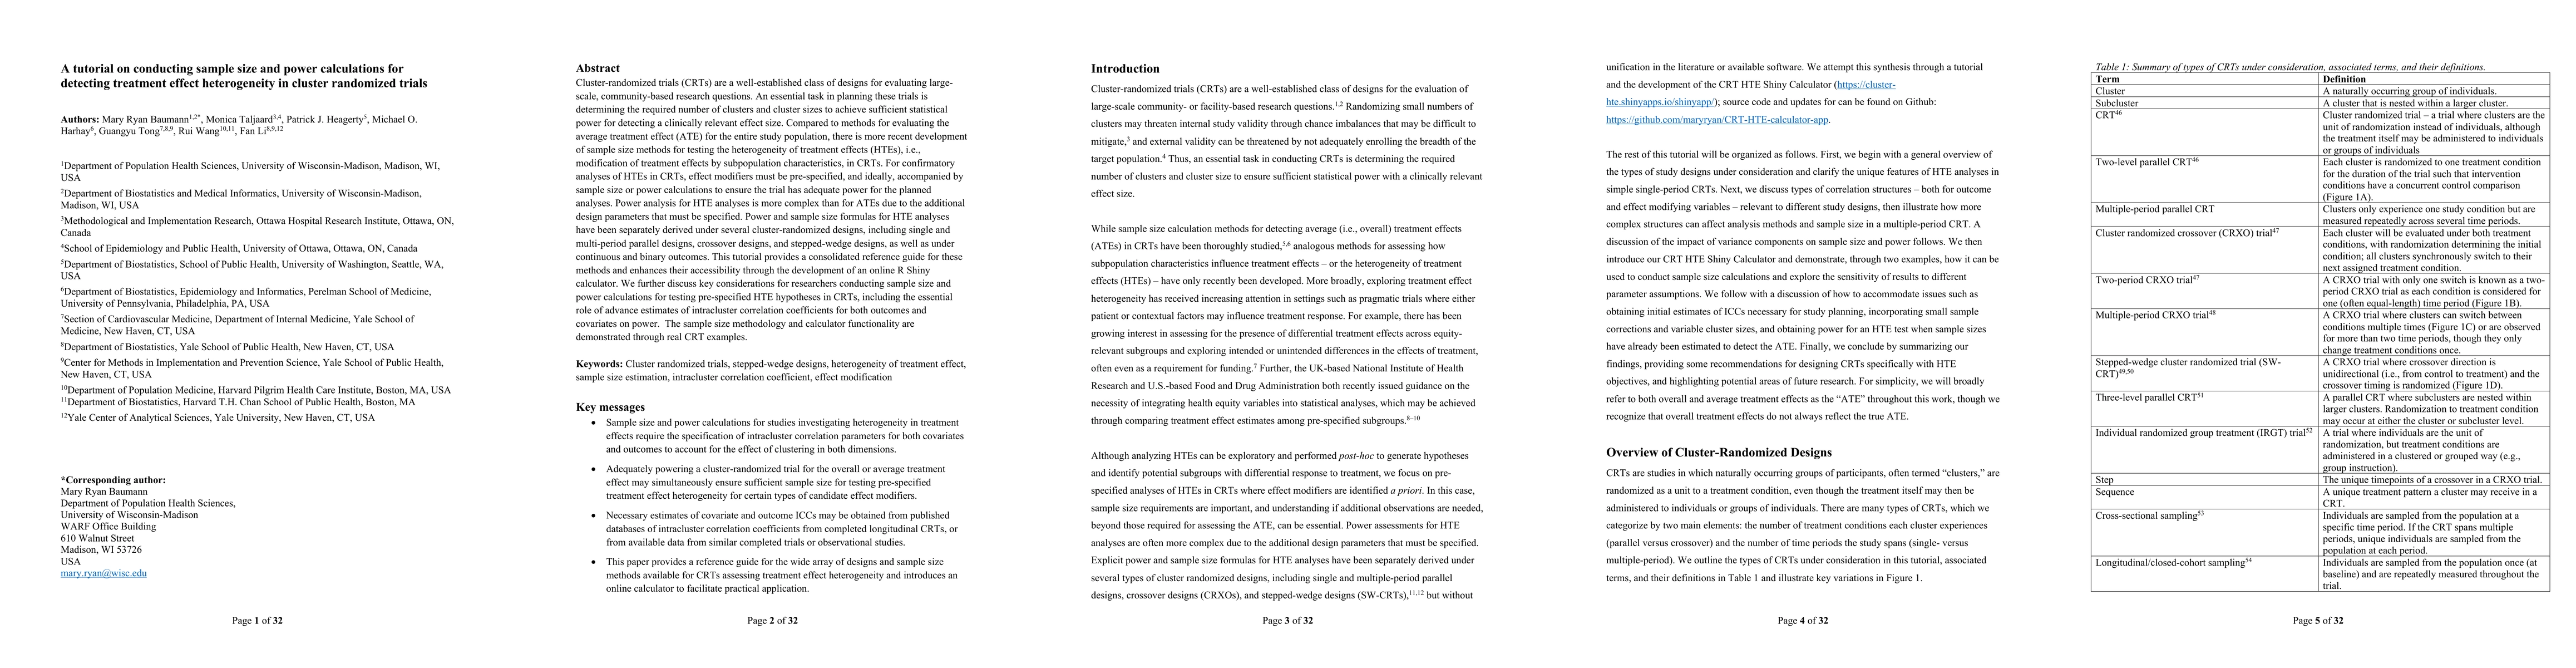
Cluster-randomized trials (CRTs) are a well-established class of designs for evaluating large-scale, community-based research questions. An essential task in planning these trials is determining the required number of clusters and cluster sizes to achieve sufficient statistical power for detecting a clinically relevant effect size. Compared to methods for evaluating the average treatment effect (ATE) for the entire study population, there is more recent development of sample size methods for testing the heterogeneity of treatment effects (HTEs), i.e., modification of treatment effects by subpopulation characteristics, in CRTs. For confirmatory analyses of HTEs in CRTs, effect modifiers must be pre-specified, and ideally, accompanied by sample size or power calculations to ensure the trial has adequate power for the planned analyses. Power analysis for HTE analyses is more complex than for ATEs due to the additional design parameters that must be specified. Power and sample size formulas for HTE analyses have been separately derived under several cluster-randomized designs, including single and multi-period parallel designs, crossover designs, and stepped-wedge designs, as well as under continuous and binary outcomes. This tutorial provides a consolidated reference guide for these methods and enhances their accessibility through the development of an online R Shiny calculator. We further discuss key considerations for researchers conducting sample size and power calculations for testing pre-specified HTE hypotheses in CRTs, including the essential role of advance estimates of intracluster correlation coefficients for both outcomes and covariates on power. The sample size methodology and calculator functionality are demonstrated through real CRT examples.
AI Key Findings
Get AI-generated insights about this paper's methodology, results, significance, and more — seven facets brought into focus.
Paper Details
Authors
PDF Preview
Related Papers
No references found for this paper.
Discussion 0