Publication
Metrics
AI Quick Summary
This tutorial explains a method for analyzing neural circuitry connectivity using Dynamic Causal Modelling and Parametric Empirical Bayes, which identifies both commonalities and differences in brain connections across individuals.
Paper Preview
Abstract
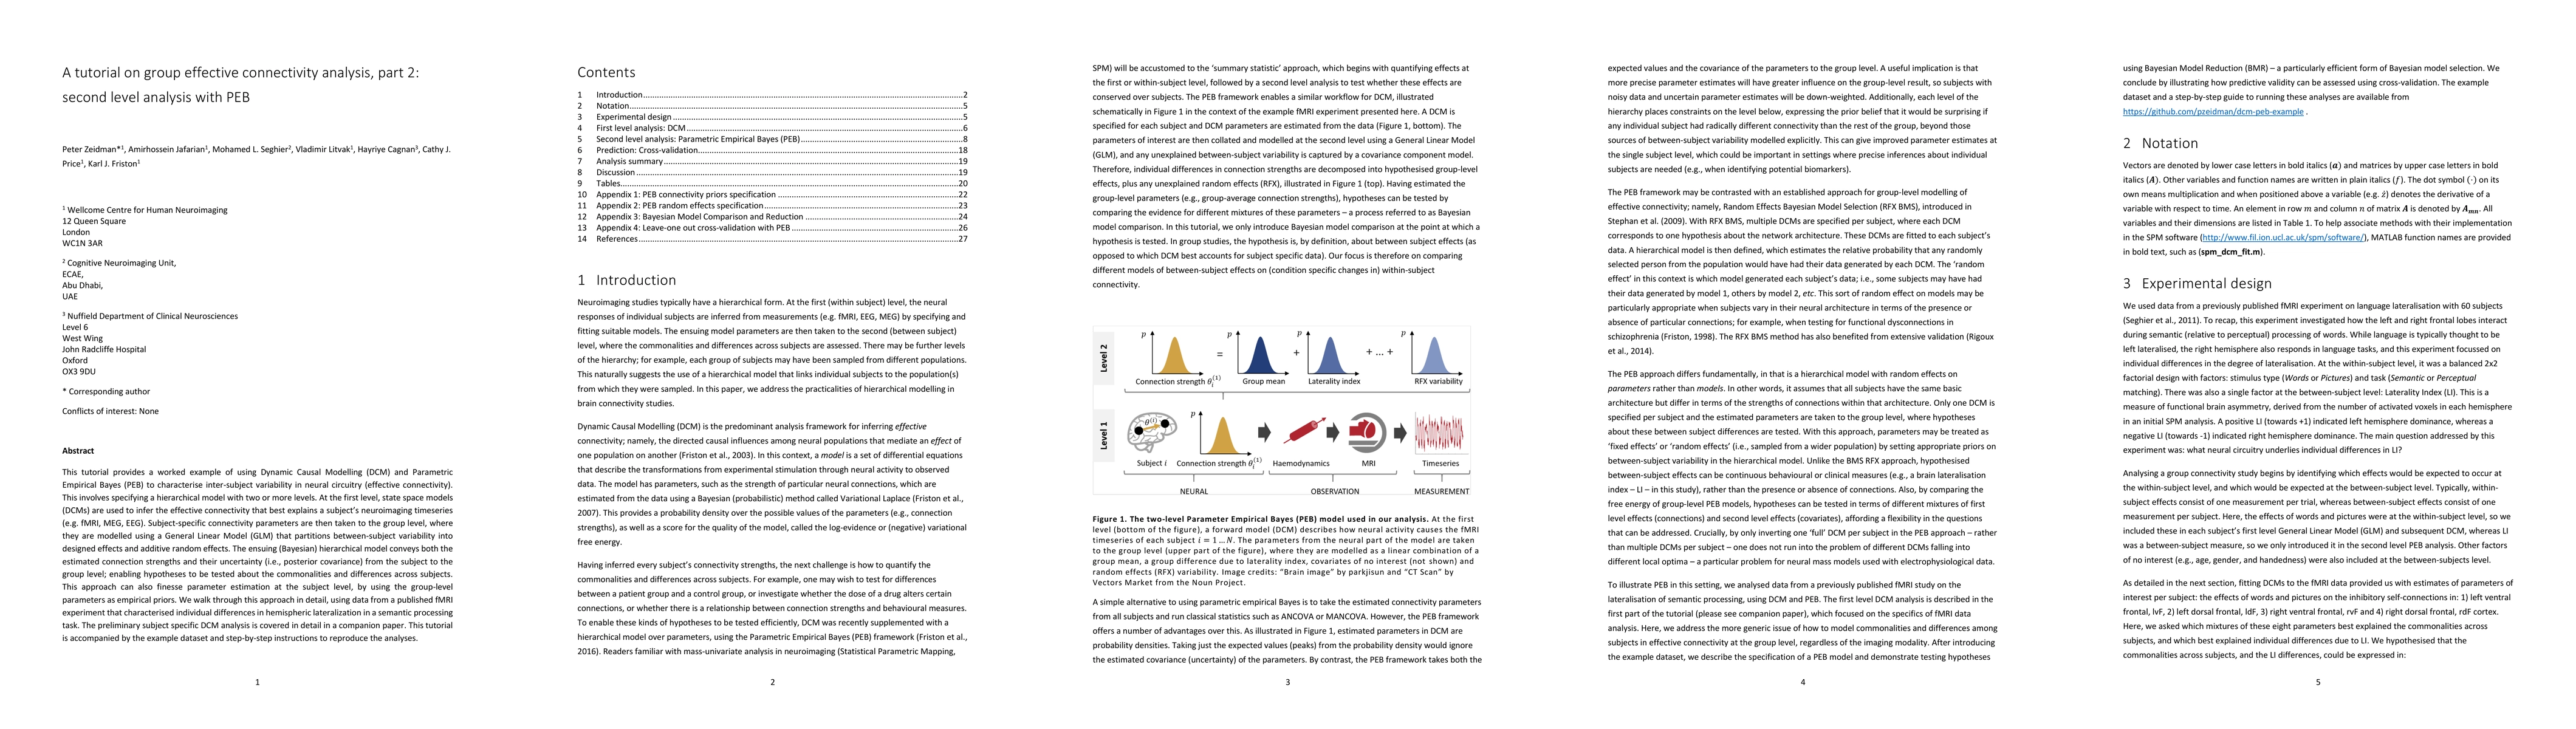
This tutorial provides a worked example of using Dynamic Causal Modelling (DCM) and Parametric Empirical Bayes (PEB) to characterise inter-subject variability in neural circuitry (effective connectivity). This involves specifying a hierarchical model with two or more levels. At the first level, state space models (DCMs) are used to infer the effective connectivity that best explains a subject's neuroimaging timeseries (e.g. fMRI, MEG, EEG). Subject-specific connectivity parameters are then taken to the group level, where they are modelled using a General Linear Model (GLM) that partitions between-subject variability into designed effects and additive random effects. The ensuing (Bayesian) hierarchical model conveys both the estimated connection strengths and their uncertainty (i.e., posterior covariance) from the subject to the group level; enabling hypotheses to be tested about the commonalities and differences across subjects. This approach can also finesse parameter estimation at the subject level, by using the group-level parameters as empirical priors. We walk through this approach in detail, using data from a published fMRI experiment that characterised individual differences in hemispheric lateralization in a semantic processing task. The preliminary subject specific DCM analysis is covered in detail in a companion paper. This tutorial is accompanied by the example dataset and step-by-step instructions to reproduce the analyses.
AI Key Findings
Get AI-generated insights about this paper's methodology, results, significance, and more — seven facets brought into focus.
Impact
Paper Details
PDF Preview
Key Terms
Citation Network
Current paper (gray), citations (green), references (blue)
Display is limited for performance on very large graphs.
Discussion 0