A User-centered Design Study in Scientific Visualization Targeting Domain Experts
Publication
Metrics
AI Quick Summary
This paper details a two-year user-centered design study with combustion scientists, resulting in an in situ visualization technique and a post hoc PDF exploration tool. The study underscores the importance of involving domain experts throughout the development process to create effective and usable scientific visualization solutions.
Paper Preview
Abstract
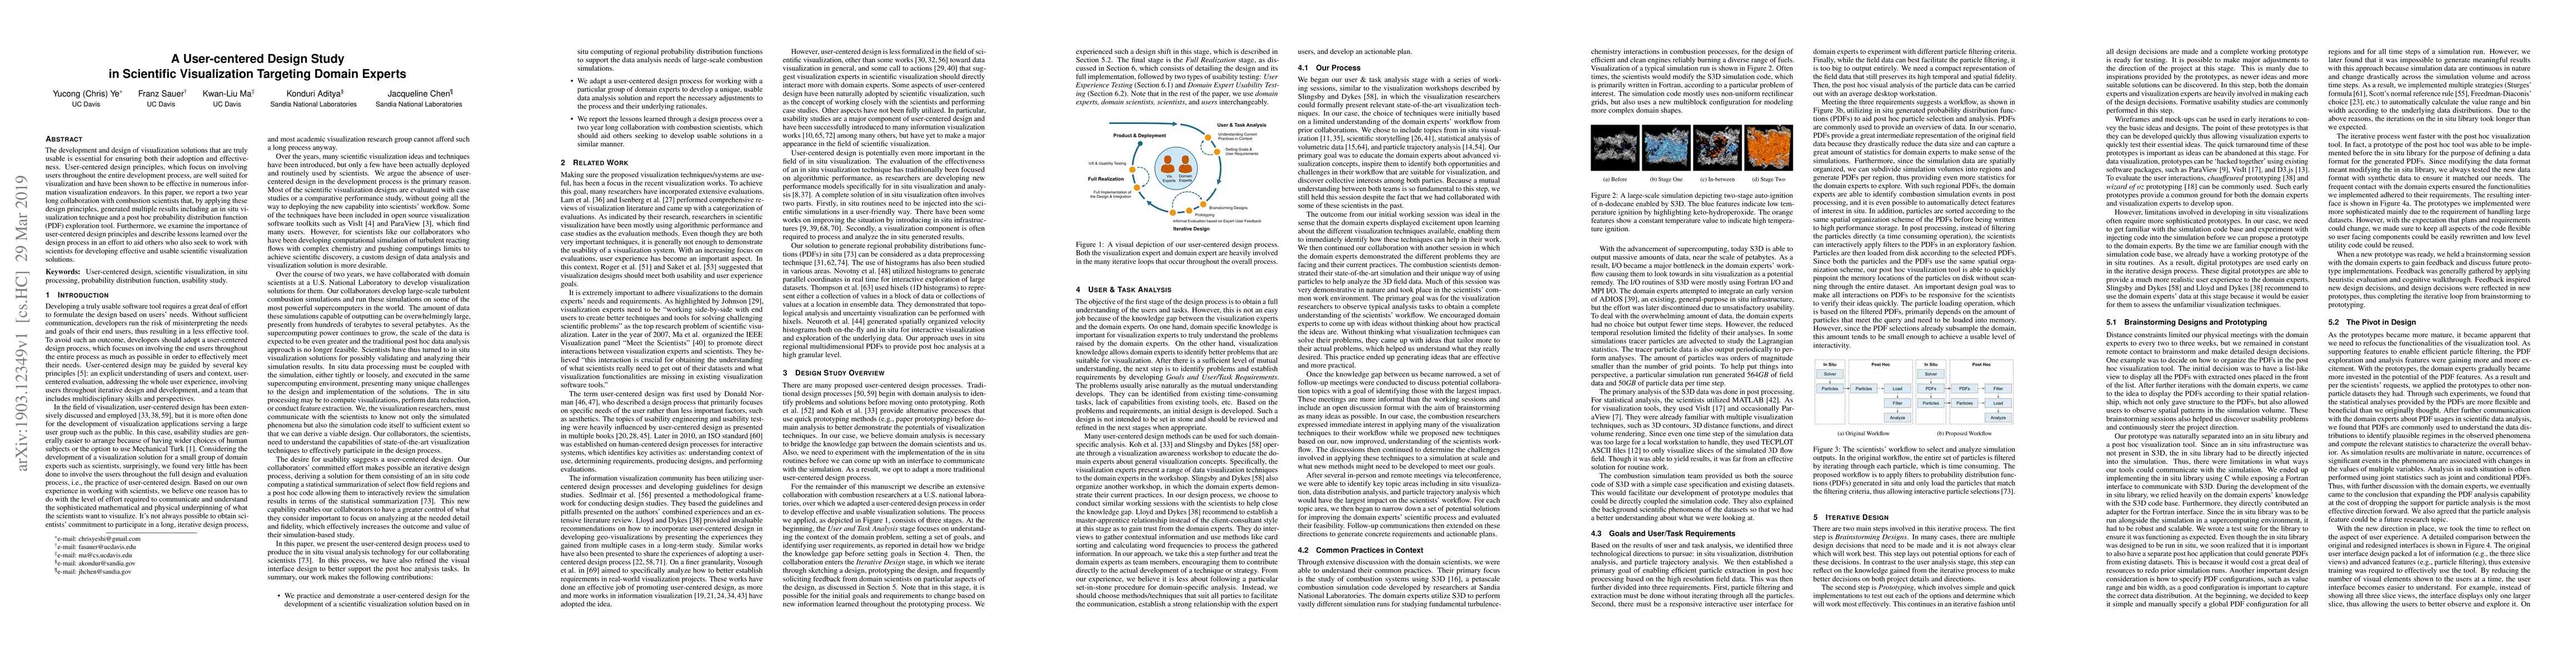
The development and design of visualization solutions that are truly usable is essential for ensuring both their adoption and effectiveness. User-centered design principles, which focus on involving users throughout the entire development process, are well suited for visualization and have been shown to be effective in numerous information visualization endeavors. In this paper, we report a two year long collaboration with combustion scientists that, by applying these design principles, generated multiple results including an in situ visualization technique and a post hoc probability distribution function (PDF) exploration tool. Furthermore, we examine the importance of user-centered design principles and describe lessons learned over the design process in an effort to aid others who also seek to work with scientists for developing effective and usable scientific visualization solutions.
AI Key Findings
Get AI-generated insights about this paper's methodology, results, significance, and more — seven facets brought into focus.
Impact
Paper Details
PDF Preview
Key Terms
Citation Network
Current paper (gray), citations (green), references (blue)
Display is limited for performance on very large graphs.
Discussion 0