01
MethodologyHow they did it
A visual analytics tool called VC-FaT was developed to integrate peoples' tweet data with city factual crime data.
This paper introduces VC-FaT, a visual analytic tool that integrates San Francisco crime tweets with city crime data, offering interactive visualizations to better understand crime trends over five years. The tool aims to enhance comprehension by juxtaposing social media reactions with factual crime statistics.
This paper introduces VC-FaT, a visual analytic tool that integrates San Francisco crime tweets with city crime data, offering interactive visualizations to better understand crime trends over five years. The tool aims to enhance comprehension by juxtaposing social media reactions with factual crime statistics.
A visual analytics tool called VC-FaT was developed to integrate peoples' tweet data with city factual crime data. More in Methodology →
VC-FaT provides interactive visualizations using both data sources for better understanding and exploration of crime activities in the city during a period of five years. — The tool allows users to view and explore data from both datasets side-by-side views or from both datasets using just one view. More in Key Results →
This research is important because it provides a comprehensive understanding of crime activities in cities by integrating social media data with factual crime data. More in Significance →
The dataset used for this study only includes tweets collected between January 1, 2018, and December 12, 2022. — The tool may not be able to capture all types of crimes or criminal activities that do not involve social media data. More in Limitations →
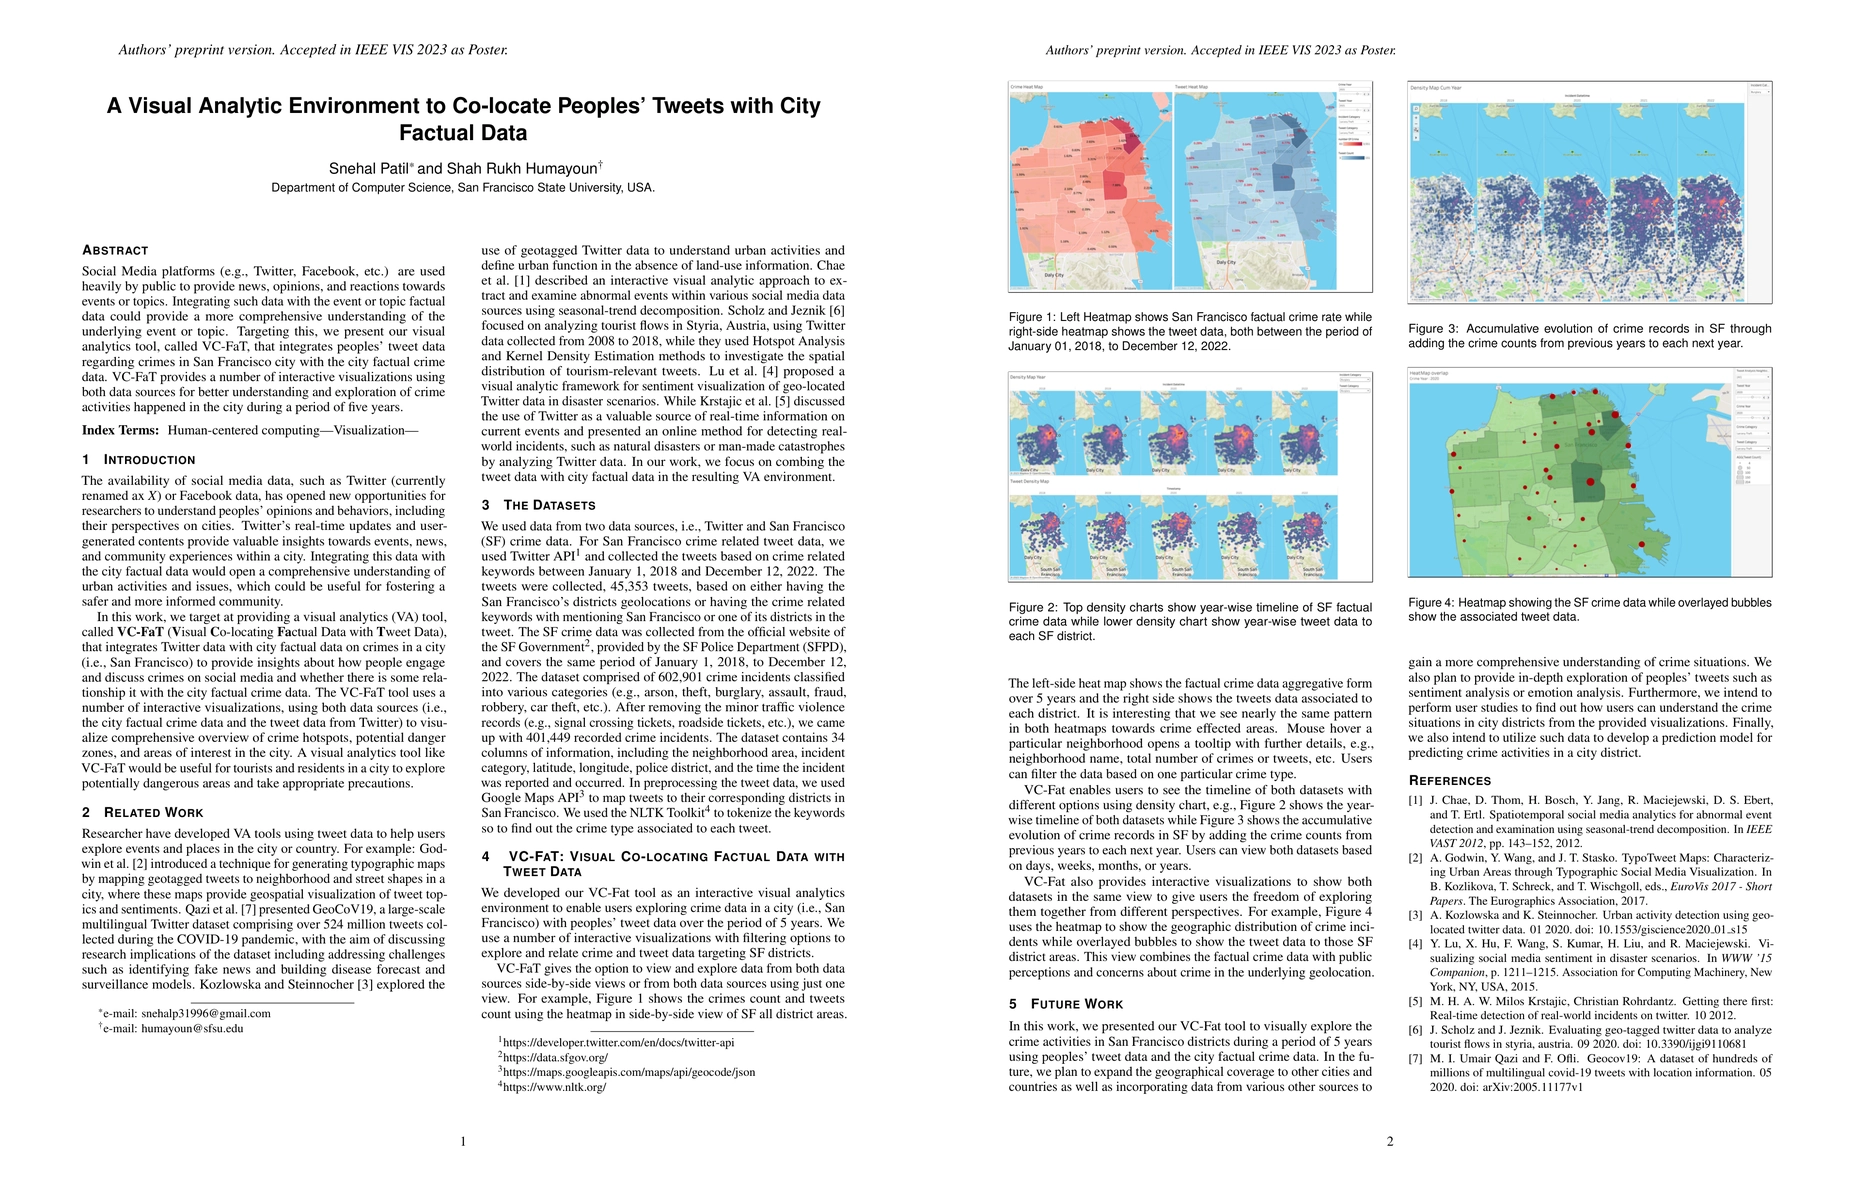
Social Media platforms (e.g., Twitter, Facebook, etc.) are used heavily by public to provide news, opinions, and reactions towards events or topics. Integrating such data with the event or topic factual data could provide a more comprehensive understanding of the underlying event or topic. Targeting this, we present our visual analytics tool, called VC-FaT, that integrates peoples' tweet data regarding crimes in San Francisco city with the city factual crime data. VC-FaT provides a number of interactive visualizations using both data sources for better understanding and exploration of crime activities happened in the city during a period of five years.
Seven facets of this paper, analysed and brought into focus by AI.
This research is important because it provides a comprehensive understanding of crime activities in cities by integrating social media data with factual crime data.
A visual analytics tool called VC-FaT was developed to integrate peoples' tweet data with city factual crime data.
This research is important because it provides a comprehensive understanding of crime activities in cities by integrating social media data with factual crime data.
The development of VC-FaT, an interactive visual analytics tool that integrates tweet data with city factual crime data.
This work is novel because it combines social media data with factual crime data to provide a comprehensive understanding of crime activities in cities.
Current paper (gray), citations (green), references (blue)
Display is limited for performance on very large graphs.
Discussion 0