A Visual-Analytical Approach for Automatic Detection of Cyclonic Events in Satellite Observations
Publication
Metrics
AI Quick Summary
This study proposes a visual-analytical approach to automatically detect and estimate the intensity of tropical cyclones in satellite observations over the North Indian Ocean using data-driven methods. The method involves a two-stage process: initial cyclone detection followed by intensity estimation using a CNN-LSTM network based on ResNet-18, aiming for faster and more accurate predictions compared to traditional physics-based simulations.
Paper Preview
Abstract
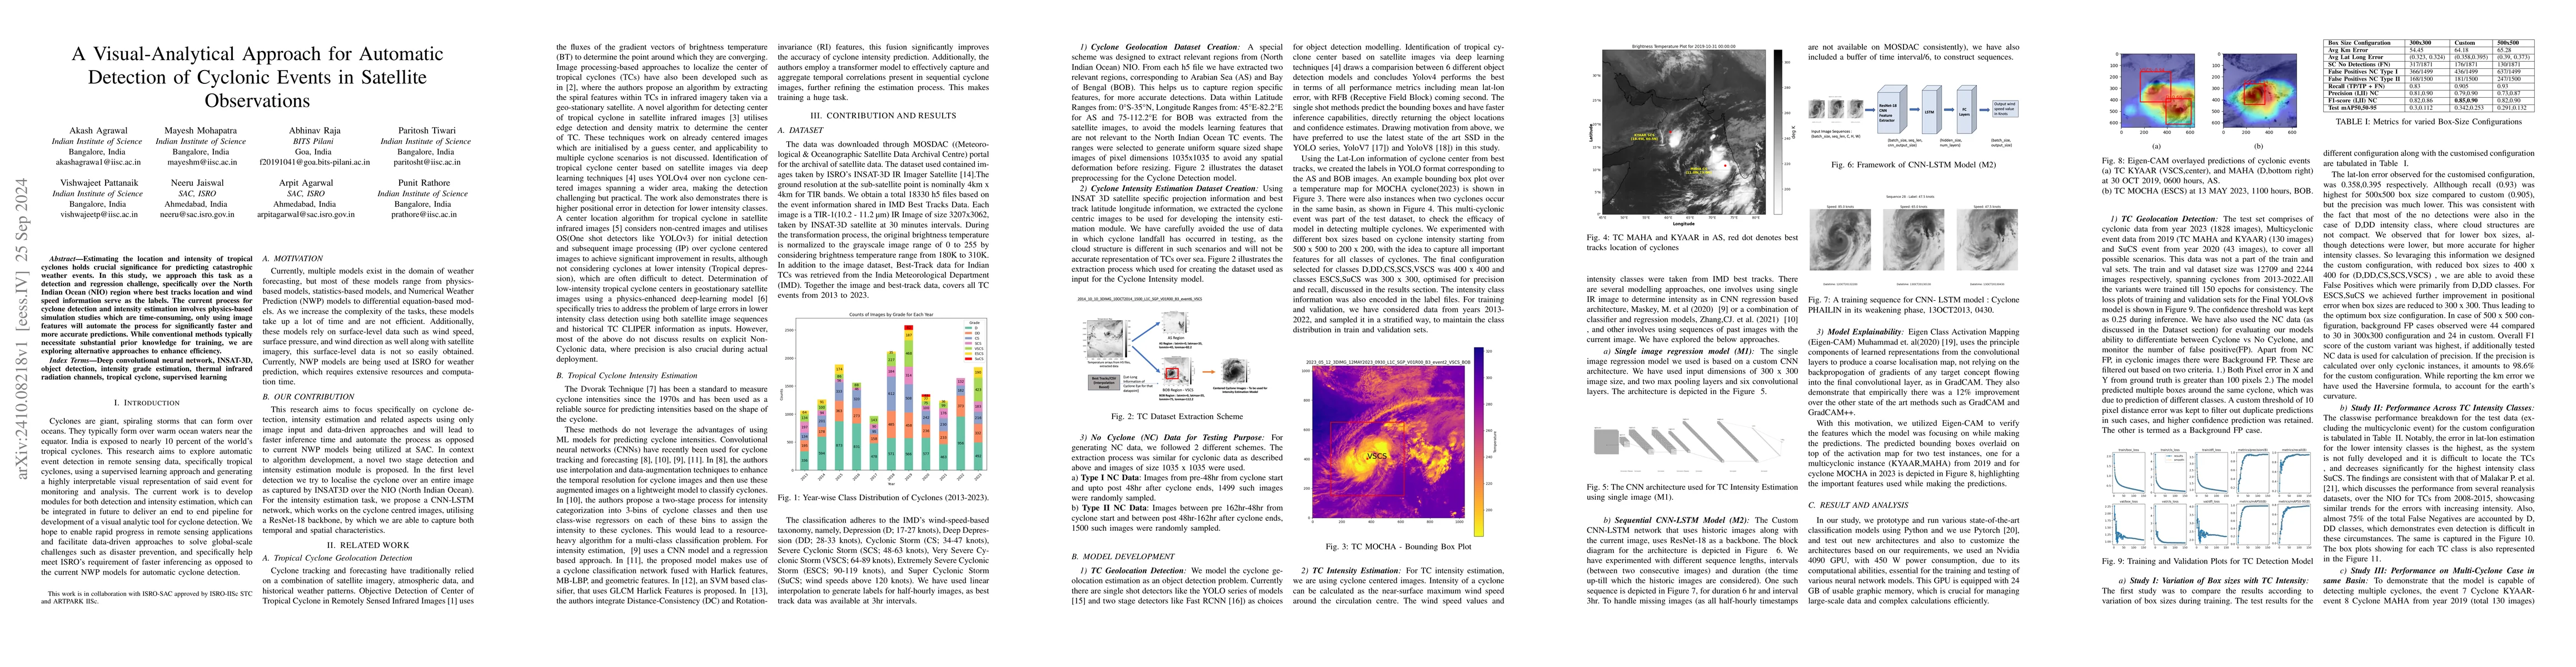
Estimating the location and intensity of tropical cyclones holds crucial significance for predicting catastrophic weather events. In this study, we approach this task as a detection and regression challenge, specifically over the North Indian Ocean (NIO) region where best tracks location and wind speed information serve as the labels. The current process for cyclone detection and intensity estimation involves physics-based simulation studies which are time-consuming, only using image features will automate the process for significantly faster and more accurate predictions. While conventional methods typically necessitate substantial prior knowledge for training, we are exploring alternative approaches to enhance efficiency. This research aims to focus specifically on cyclone detection, intensity estimation and related aspects using only image input and data-driven approaches and will lead to faster inference time and automate the process as opposed to current NWP models being utilized at SAC. In context to algorithm development, a novel two stage detection and intensity estimation module is proposed. In the first level detection we try to localize the cyclone over an entire image as captured by INSAT3D over the NIO (North Indian Ocean). For the intensity estimation task, we propose a CNN-LSTM network, which works on the cyclone centered images, utilizing a ResNet-18 backbone, by which we are able to capture both temporal and spatial characteristics.
AI Key Findings
Get AI-generated insights about this paper's methodology, results, significance, and more — seven facets brought into focus.
Impact
Paper Details
Authors
PDF Preview
Citation Network
Current paper (gray), citations (green), references (blue)
Display is limited for performance on very large graphs.
Discussion 0