This paper proposes a visual interaction framework to enhance the interpretability of dimensionality-reduction techniques. It introduces forward and backward projection methods, along with prolines and feasibility maps, to facilitate dynamic reasoning about reduced data, demonstrating its application to PCA and autoencoders.
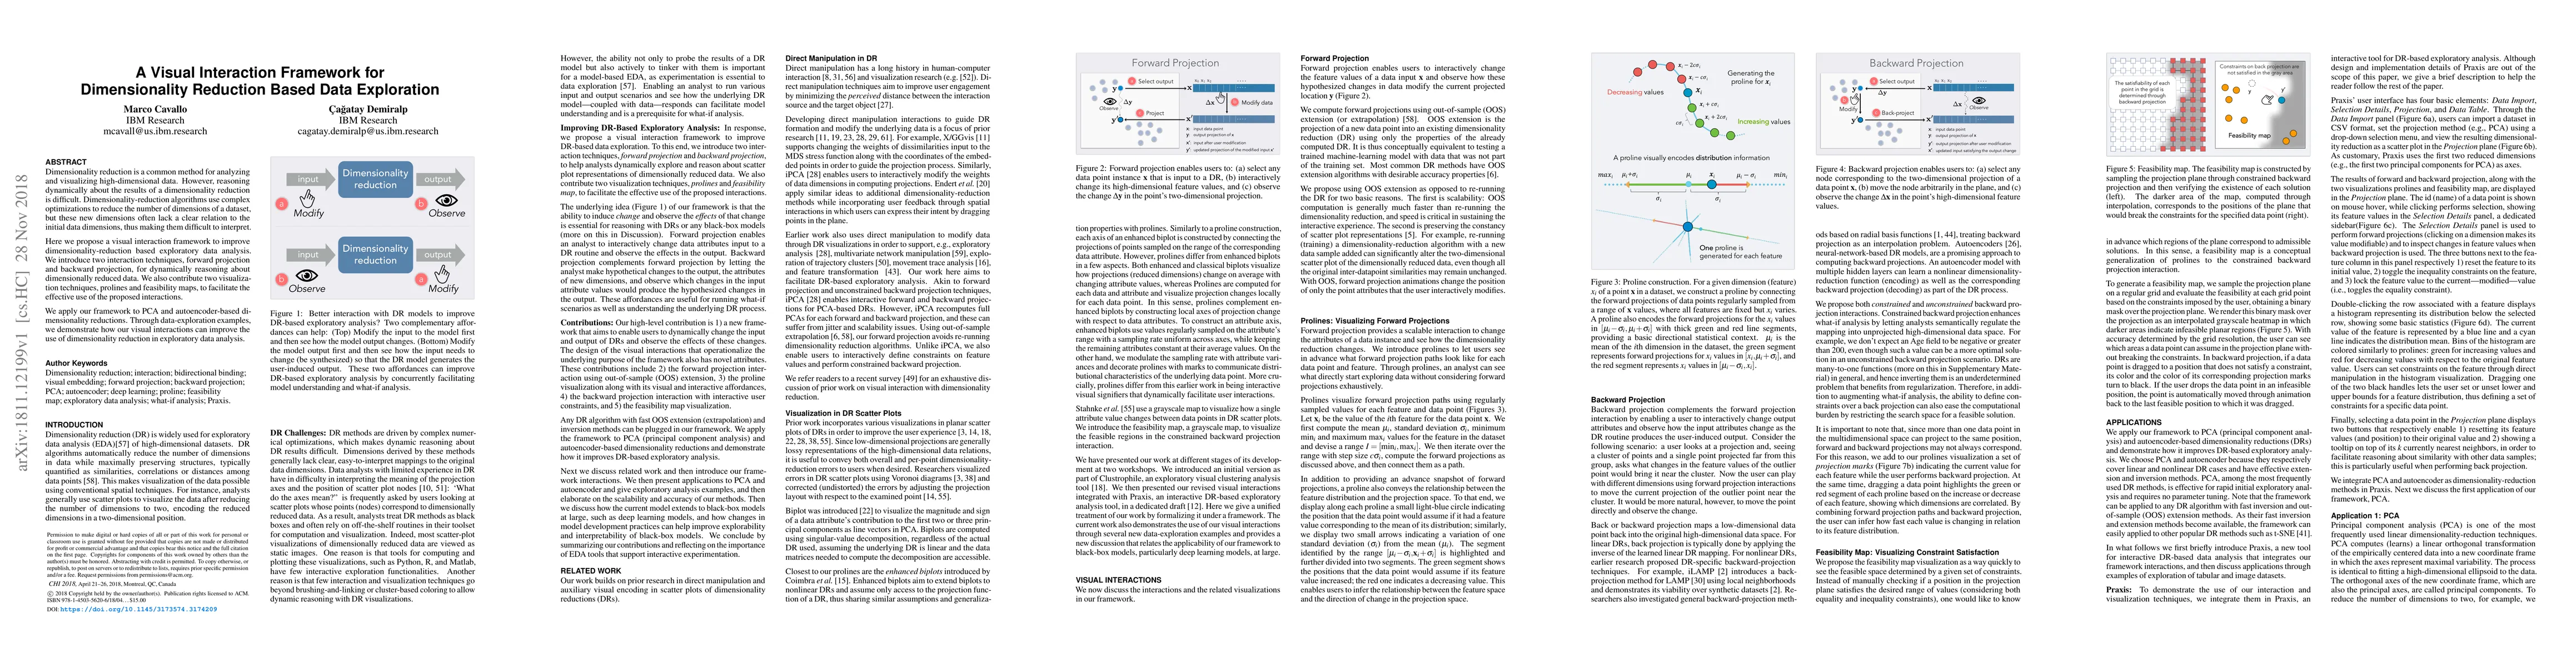
Dimensionality reduction is a common method for analyzing and visualizing high-dimensional data. However, reasoning dynamically about the results of a dimensionality reduction is difficult. Dimensionality-reduction algorithms use complex optimizations to reduce the number of dimensions of a dataset, but these new dimensions often lack a clear relation to the initial data dimensions, thus making them difficult to interpret. Here we propose a visual interaction framework to improve dimensionality-reduction based exploratory data analysis. We introduce two interaction techniques, forward projection and backward projection, for dynamically reasoning about dimensionally reduced data. We also contribute two visualization techniques, prolines and feasibility maps, to facilitate the effective use of the proposed interactions. We apply our framework to PCA and autoencoder-based dimensionality reductions. Through data-exploration examples, we demonstrate how our visual interactions can improve the use of dimensionality reduction in exploratory data analysis.
Get AI-generated insights about this paper's methodology, results, and significance.
Current paper (gray), citations (green), references (blue)
Title | Authors | Year | Actions |
---|---|---|---|
Unveiling High-dimensional Backstage: A Survey for Reliable Visual Analytics with Dimensionality Reduction
|
Hyeon Jeon, Hyunwoo Lee, Yun-Hsin Kuo, Taehyun Yang, Daniel Archambault, Sungahn Ko, Takanori Fujiwara, Kwan-Liu Ma, Jinwook Seo
|
2025
|
View Paper |
Mesoscopic structure graphs for interpreting uncertainty in non-linear embeddings
|
Junhan Zhao, Xiang Liu, Hongping Tang, Xiyue Wang, Sen Yang, Donfang Liu, Yijiang Chen, Victor Y. Chen
|
2024
|
View Paper |
Gradient-based explanation for non-linear non-parametric dimensionality reduction
|
Sacha Corbugy, Rebecca Marion, Benoît Frénay
|
2024
|
View Paper |
DimBridge: Interactive Explanation of Visual Patterns in Dimensionality Reductions with Predicate Logic
|
Brian Montambault, G. Appleby, Jen Rogers, C. Brumar, Mingwei Li, Remco Chang
|
2024
|
View Paper |
DimVis: Interpreting Visual Clusters in Dimensionality Reduction With Explainable Boosting Machine
|
Parisa Salmanian, Angelos Chatzimparmpas, Ali Can Karaca, Rafael M. Martins
|
2024
|
View Paper |
From Machine Learning to Patient Outcomes: A Comprehensive Review of AI in Pancreatic Cancer
|
Satvik Tripathi, A. Tabari, Arian Mansur, Harika Dabbara, Christopher P. Bridge, Dania Daye
|
2024
|
View Paper |
Interpreting High-Dimensional Projections With Capacity
|
Yang Zhang, Jisheng Liu, Chufan Lai, Yuan Zhou, Siming Chen
|
2023
|
View Paper |
Explainable interactive projections of images
|
Huimin Han, Rebecca Faust, Brian Felipe Keith Norambuena, Jiayue Lin, Song Li, Chris North
|
2023
|
View Paper |
Visual Analytics of Multivariate Networks with Representation Learning and Composite Variable Construction
|
Hsiao-Ying Lu, Takanori Fujiwara, Ming-Yi Chang, Yang-chih Fu, A. Ynnerman, Kwan-Liu Ma
|
2023
|
View Paper |
Diagrammatization and Abduction to Improve AI Interpretability With Domain-Aligned Explanations for Medical Diagnosis
|
Brian Y. Lim, Joseph P. Cahaly, Chester Y. F. Sng, Adam Chew
|
2023
|
View Paper |
A Comparative Dimensionality Reduction Study in Diabetes Patients using LDA and PCA
|
Haidar Khalid Al-Tammie, N. Al-Anber
|
2022
|
View Paper |
iHELP: interactive hierarchical linear projections for interpreting non-linear projections
|
Xingchen Zeng, Haowen Zhou, Zhicong Li, Chenqi Zhang, Juncong Lin, Jiazhi Xia, Yanyi Yang, Xiaoyan Kui
|
2022
|
View Paper |
ClassMat: a Matrix of Small Multiples to Analyze the Topology of Multiclass Multidimensional Data
|
Michaël Aupetit, A. Ali, Abdelkader Baggag, H. Bensmail
|
2022
|
View Paper |
Evaluation of Various DR Techniques in Massive Patient Datasets using HDFS
|
Dr. K. B. V. Brahma Rao, Dr. R Krishnam Raju Indukuri, Dr. Suresh Varma Penumatsa, Dr. M. V. Rama Sundari
|
2021
|
View Paper |
ExClus: Explainable Clustering on Low-dimensional Data Representations
|
Xander Vankwikelberge, Bo Kang, Edith Heiter, Jefrey Lijffijt
|
2021
|
View Paper |
UnProjection: Leveraging Inverse-Projections for Visual Analytics of High-Dimensional Data
|
M. Espadoto, G. Appleby, Ashley Suh, Dylan Cashman, Mingwei Li, C. Scheidegger, Erik W. Anderson, Remco Chang, A. Telea
|
2021
|
View Paper |
Semantic Explanation of Interactive Dimensionality Reduction
|
Yail Bian, Chris North, Eric Krokos, Sarah Joseph
|
2021
|
View Paper |
Augmenting Decision Making via Interactive What-If Analysis
|
Sneha Gathani, Madelon Hulsebos, James Gale, P. Haas, cCaugatay Demiralp
|
2021
|
View Paper |
Attribute-based Explanation of Non-Linear Embeddings of High-Dimensional Data
|
Jan-Tobias Sohns, M. Schmitt, F. Jirasek, H. Hasse, H. Leitte
|
2021
|
View Paper |
Interactive Dimensionality Reduction for Comparative Analysis
|
Takanori Fujiwara, Xinhai Wei, Jian Zhao, K. Ma
|
2021
|
View Paper |
HyperNP: Interactive Visual Exploration of Multidimensional Projection Hyperparameters
|
G. Appleby, M. Espadoto, Rui Chen, Sam Goree, A. Telea, Erik W. Anderson, Remco Chang
|
2021
|
View Paper |
ParSetgnostics: Quality Metrics for Parallel Sets
|
Frederik L. Dennig, M. T. Fischer, M. Blumenschein, Johannes Fuchs, D. Keim, Evanthia Dimara
|
2021
|
View Paper |
Higher Dimensional Graphics: Conceiving Worlds in Four Spatial Dimensions and Beyond
|
M. Cavallo
|
2021
|
View Paper |
SemanticAxis: exploring multi-attribute data by semantic construction and ranking analysis
|
Zeyu Li, Changhong Zhang, Yi Zhang, Jiawan Zhang
|
2021
|
View Paper |
Evaluating the Interpretability of Generative Models by Interactive Reconstruction
|
A. Ross, Nina Chen, Elisa Zhao Hang, Elena L. Glassman, F. Doshi-Velez
|
2021
|
View Paper |
Interpretable feature subset selection: A Shapley value based approach
|
Sandhya Tripathi, N. Hemachandra, Prashant Trivedi
|
2020
|
View Paper |
Conditional t-SNE: more informative t-SNE embeddings
|
Bo Kang, Darío García García, Jefrey Lijffijt, Raúl Santos-Rodríguez, T. D. Bie
|
2020
|
View Paper |
A Distance-Preserving Matrix Sketch
|
Leland Wilkinson, Hengrui Luo
|
2020
|
View Paper |
Implicit Multidimensional Projection of Local Subspaces
|
Rongzhen Bian, Yumeng Xue, Liang Zhou, Jian Zhang, Baoquan Chen, D. Weiskopf, Yunhai Wang
|
2020
|
View Paper |
ChartSeer: Interactive Steering Exploratory Visual Analysis With Machine Intelligence
|
Jian Zhao, Mingming Fan, Mi Feng
|
2020
|
View Paper |
A comprehensive survey of anomaly detection techniques for high dimensional big data
|
Srikanth Thudumu, P. Branch, Jiong Jin, Jugdutt Singh
|
2020
|
View Paper |
Making Sense of Scientific Simulation Ensembles With Semantic Interaction
|
M. Dahshan, Nicholas F. Polys, R. Jayne, R. Pollyea
|
2020
|
View Paper |
The State of the Art in Enhancing Trust in Machine Learning Models with the Use of Visualizations
|
Angelos Chatzimparmpas, R. M. Martins, Ilir Jusufi, Kostiantyn Kucher, Fabrice Rossi, A. Kerren
|
2020
|
View Paper |
Visual Analytics for Dimension Reduction and Cluster Analysis of High Dimensional Electronic Health Records
|
Sheikh S. Abdullah, Neda Rostamzadeh, K. Sedig, A. Garg, E. McArthur
|
2020
|
View Paper |
Fuzzy ARTMAP driven features selection: towards a system to design information fusion for the geographic discovery
|
P. F. Prado, I. C. S. Duarte
|
2020
|
View Paper |
A review, framework, and R toolkit for exploring, evaluating, and comparing visualization methods
|
Stephen L. France, Ulas Akkucuk
|
2020
|
View Paper |
t-viSNE: Interactive Assessment and Interpretation of t-SNE Projections
|
Angelos Chatzimparmpas, R. M. Martins, A. Kerren
|
2020
|
View Paper |
On Feature Interactions Identified by Shapley Values of Binary Classification Games
|
Sandhya Tripathi, N. Hemachandra, Prashant Trivedi
|
2020
|
View Paper |
The Principles and Limits of Algorithm-in-the-Loop Decision Making
|
Ben Green, Yiling Chen
|
2019
|
View Paper |
Immersive Insights: A Hybrid Analytics System forCollaborative Exploratory Data Analysis
|
M. Cavallo, M. Dholakia, Matous Havlena, Kenneth Ocheltree, Mark Podlaseck
|
2019
|
View Paper |
A Distributed Approach for High-Dimensionality Heterogeneous Data Reduction
|
Rania MKHININI GAHAR, Olfa Arfaoui, Minyar Sassi Hidri, N. Hadj-Alouane
|
2019
|
View Paper |
Active Learning for Image Recognition Using a Visualization-Based User Interface
|
C. Limberg, Kathrin Krieger, H. Wersing, H. Ritter
|
2019
|
View Paper |
Semantic Concept Spaces: Guided Topic Model Refinement using Word-Embedding Projections
|
Mennatallah El-Assady, Rebecca Kehlbeck, C. Collins, D. Keim, O. Deussen
|
2019
|
View Paper |
Conditional t-SNE: Complementary t-SNE embeddings through factoring out prior information
|
Bo Kang, Dario García-García, Jefrey Lijffijt, Raúl Santos-Rodríguez, T. D. Bie
|
2019
|
View Paper |
Dataspace: A Reconfigurable Hybrid Reality Environment for Collaborative Information Analysis
|
M. Cavallo, M. Dholakia, Matous Havlena, Kenneth Ocheltree, Mark Podlaseck
|
2019
|
View Paper |
Drag and Track: A Direct Manipulation Interface for Contextualizing Data Instances within a Continuous Parameter Space
|
Daniel Orban, Daniel F. Keefe, Ayan Biswas, J. Ahrens, D. Rogers
|
2019
|
View Paper |
DimReader: Axis lines that explain non-linear projections
|
Rebecca Faust, C. Scheidegger
|
2017
|
View Paper |
Diagrammatization: Rationalizing with diagrammatic AI explanations for abductive reasoning on hypotheses
|
Brian Y. Lim, Joseph P. Cahaly, Chester Y. F. Sng, Adam Chew
|
2023
|
View Paper |
Globally local and fast explanations of t-SNE-like nonlinear embeddings
|
Pierre Lambert, Rebecca Marion, J. Albert, Emmanuel Jean, Sacha Corbugy, Cyril de Bodt
|
2022
|
View Paper |
Explainable Interactive Projections for Image Data
|
Huimin Han, Rebecca Faust, Brian Felipe Keith Norambuena, R. Prabhu, T. Smith, Song Li, Chris North
|
2022
|
View Paper |
A Visual Analytics Interface for Formulating Evaluation Metrics of Multi-Dimensional Time-Series Data
|
Rei Takami, H. Shibata, Y. Takama
|
2021
|
View Paper |
Visual Analytics of Electronic Health Records with a focus on Acute Kidney Injury
|
Sheikh S. Abdullah
|
2020
|
View Paper |
Towards a Generalized Similarity Service
|
A. Bhamidipaty, D. Gruen, S. Patel, D. Soroker
|
2018
|
View Paper |
Comments (0)