Publication
Metrics
Paper Preview
Abstract
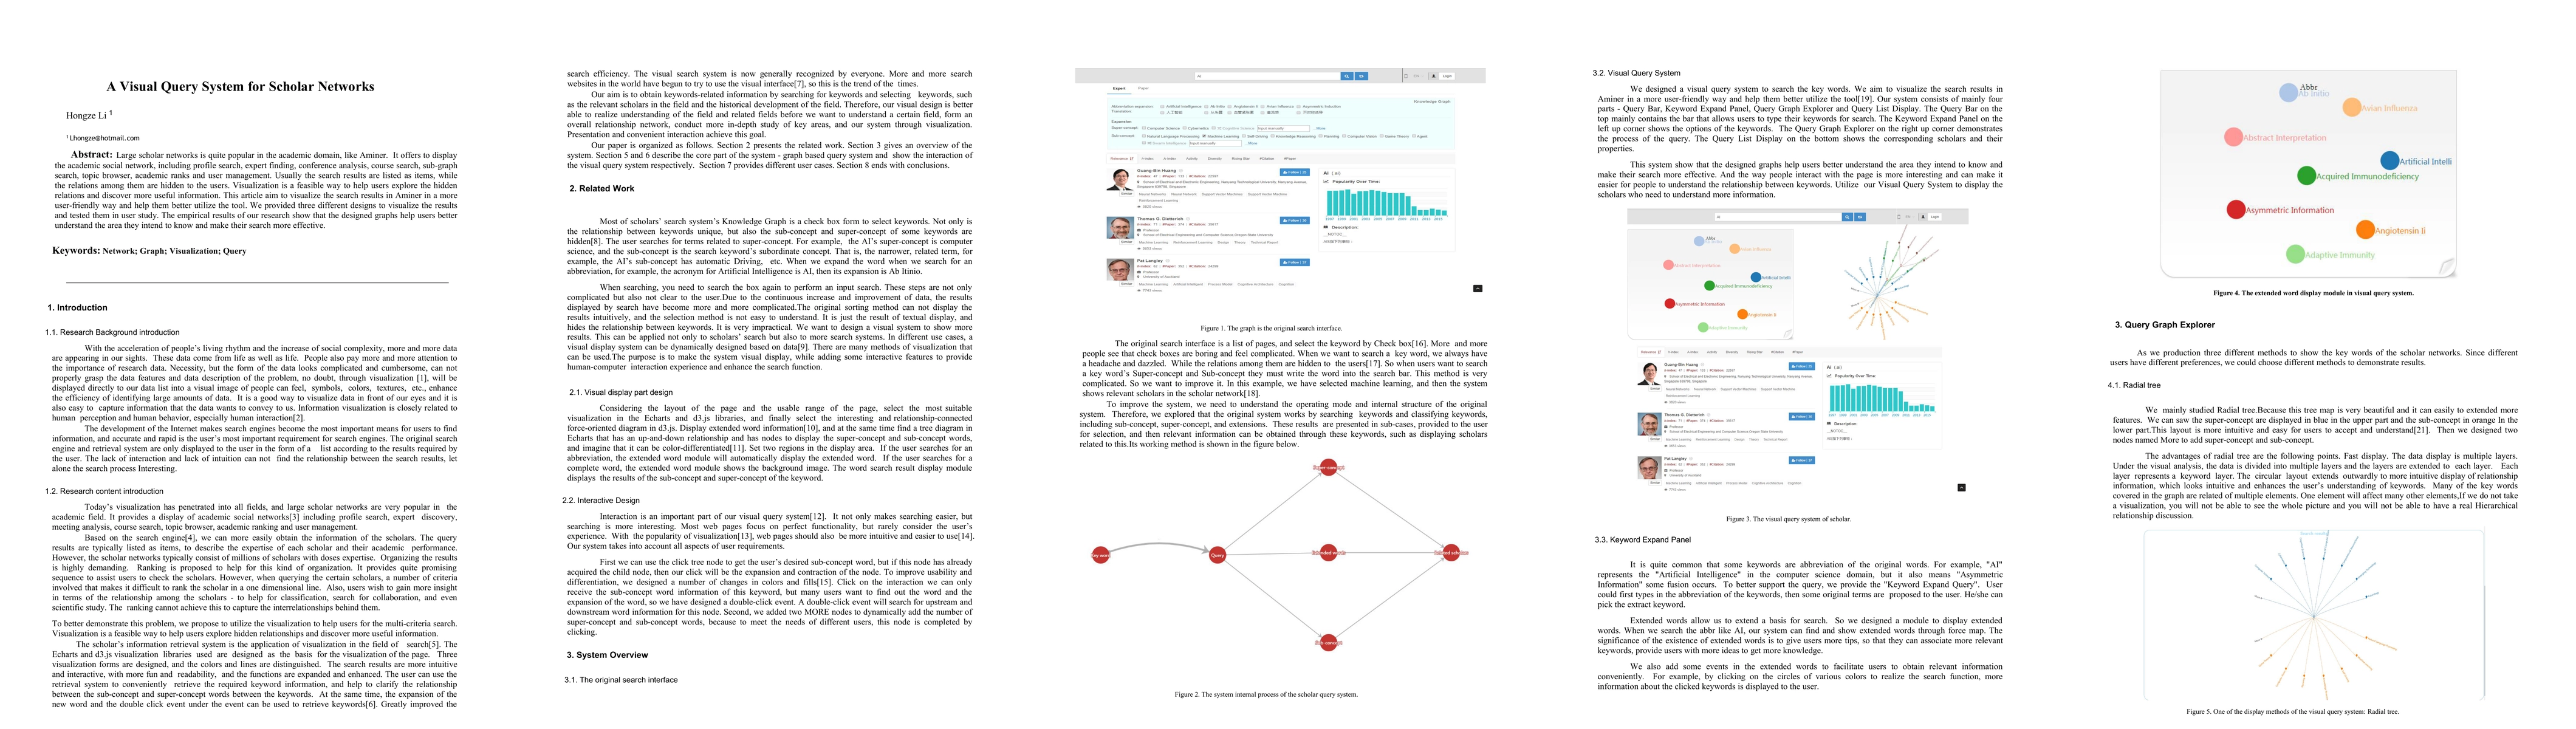
Large scholar networks is quite popular in the academic domain, like Aminer. It offers to display the academic social network, including profile search, expert finding, conference analysis, course search, sub-graph search, topic browser, academic ranks and user management. Usually the search results are listed as items, while the relations among them are hidden to the users. Visualization is a feasible way to help users explore the hidden relations and discover more useful information. This article aim to visualize the search results in Aminer in a more user-friendly way and help them better utilize the tool. We provided three different designs to visualize the results and tested them in user study. The empirical results of our research show that the designed graphs help users better understand the area they intend to know and make their search more effective.
AI Key Findings
Get AI-generated insights about this paper's methodology, results, significance, and more — seven facets brought into focus.
Impact
Paper Details
PDF Preview
Key Terms
Citation Network
Current paper (gray), citations (green), references (blue)
Display is limited for performance on very large graphs.
Discussion 0