A Visual Tool for Interactive Model Explanation using Sensitivity Analysis
Publication
Metrics
Paper Preview
Abstract
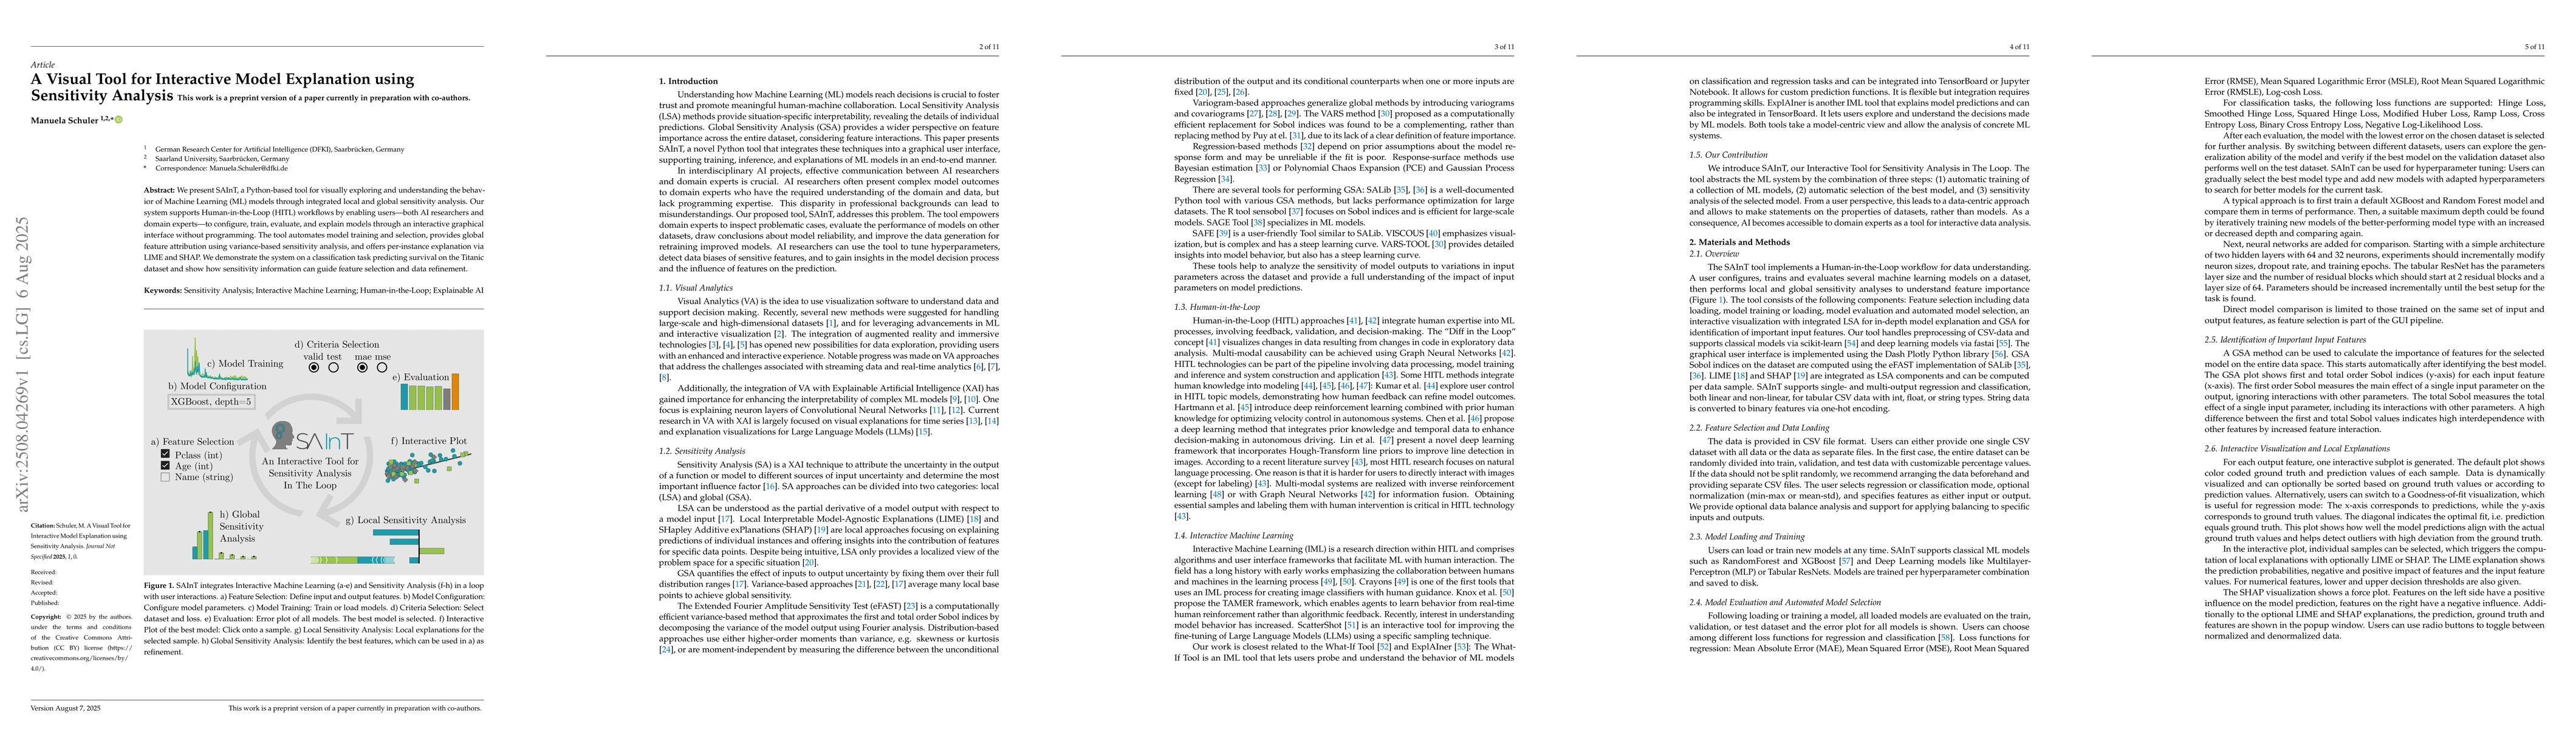
We present SAInT, a Python-based tool for visually exploring and understanding the behavior of Machine Learning (ML) models through integrated local and global sensitivity analysis. Our system supports Human-in-the-Loop (HITL) workflows by enabling users - both AI researchers and domain experts - to configure, train, evaluate, and explain models through an interactive graphical interface without programming. The tool automates model training and selection, provides global feature attribution using variance-based sensitivity analysis, and offers per-instance explanation via LIME and SHAP. We demonstrate the system on a classification task predicting survival on the Titanic dataset and show how sensitivity information can guide feature selection and data refinement.
OpenAlex
- Citations in OpenAlex
- 0
- Publication year
- 2025
- Access status
- Open access
Source: OpenAlex · Snapshot
AI Key Findings
Get AI-generated insights about this paper's methodology, results, significance, and more — seven facets brought into focus.
Discussion 0