ABROCA Distributions For Algorithmic Bias Assessment: Considerations Around Interpretation
Publication
Metrics
AI Quick Summary
This paper examines the statistical properties of the Absolute Between-ROC Area (ABROCA) metric for detecting algorithmic bias. Findings reveal that ABROCA distributions are highly skewed depending on sample size and class imbalance, potentially inflating bias detection values erroneously, thus necessitating careful interpretation of ABROCA when assessing classifier performance.
Paper Preview
Abstract
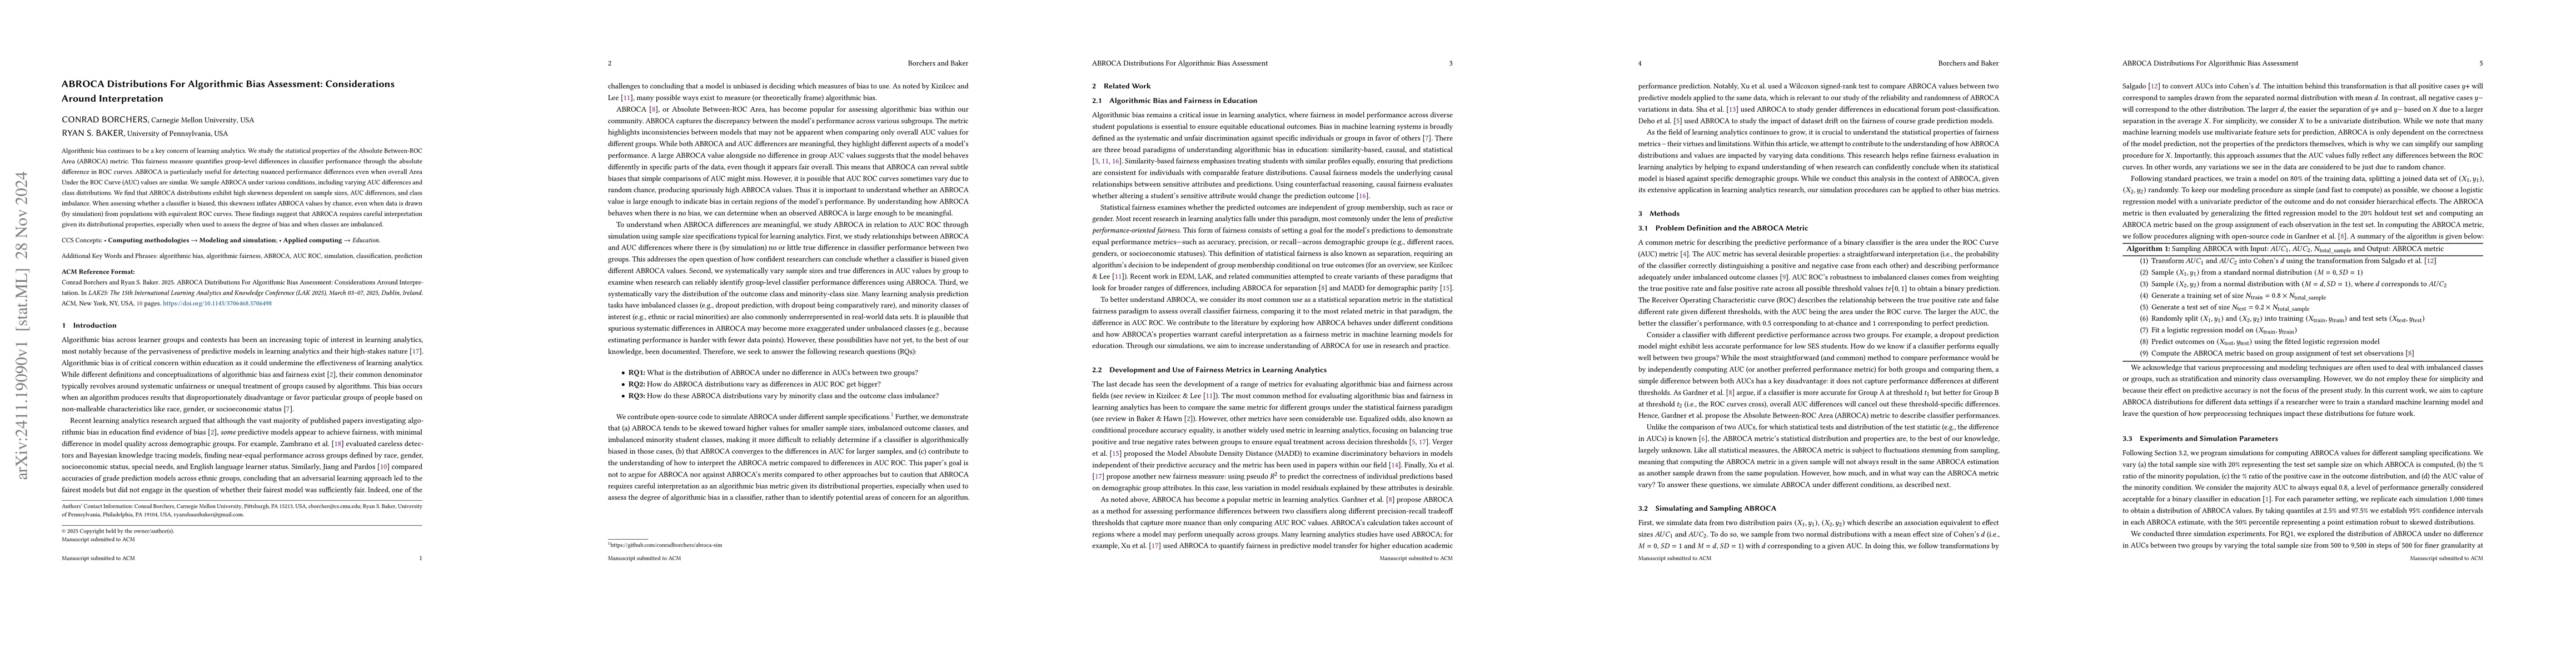
Algorithmic bias continues to be a key concern of learning analytics. We study the statistical properties of the Absolute Between-ROC Area (ABROCA) metric. This fairness measure quantifies group-level differences in classifier performance through the absolute difference in ROC curves. ABROCA is particularly useful for detecting nuanced performance differences even when overall Area Under the ROC Curve (AUC) values are similar. We sample ABROCA under various conditions, including varying AUC differences and class distributions. We find that ABROCA distributions exhibit high skewness dependent on sample sizes, AUC differences, and class imbalance. When assessing whether a classifier is biased, this skewness inflates ABROCA values by chance, even when data is drawn (by simulation) from populations with equivalent ROC curves. These findings suggest that ABROCA requires careful interpretation given its distributional properties, especially when used to assess the degree of bias and when classes are imbalanced.
AI Key Findings
Get AI-generated insights about this paper's methodology, results, significance, and more — seven facets brought into focus.
Impact
Paper Details
Authors
PDF Preview
Citation Network
Current paper (gray), citations (green), references (blue)
Display is limited for performance on very large graphs.
Discussion 0