Summary
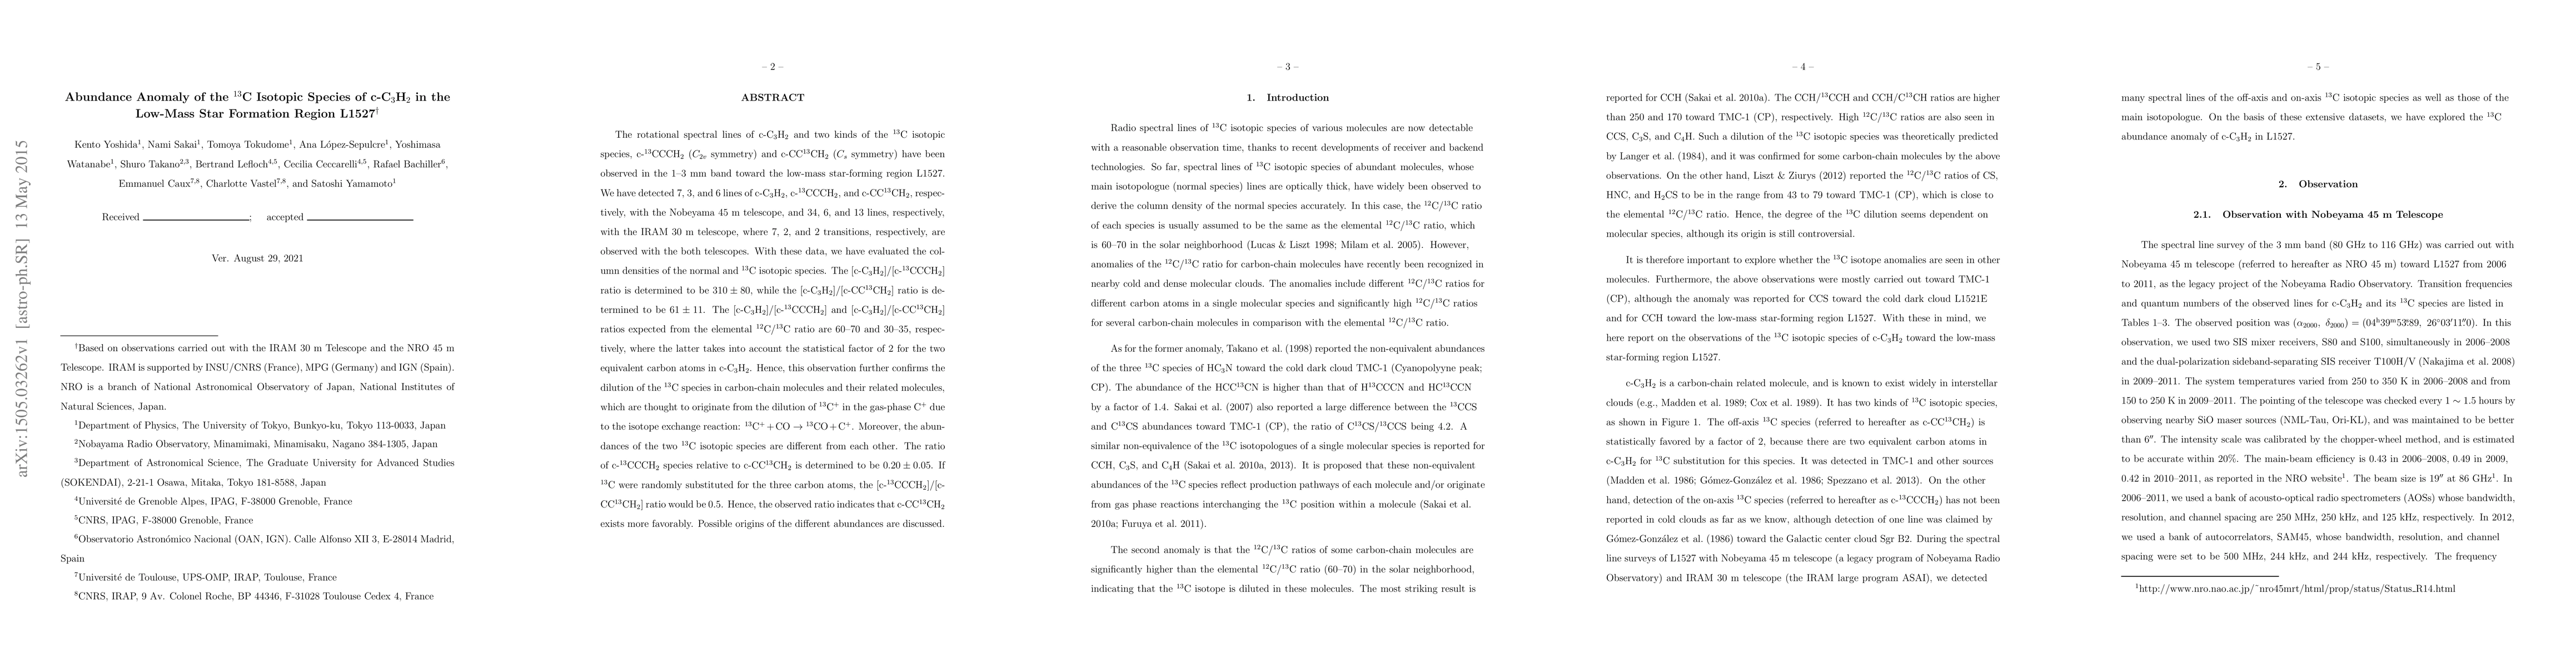
The rotational spectral lines of c-C$_3$H$_2$ and two kinds of the $^{13}$C isotopic species, c-$^{13}$CCCH$_2$ ($C_{2v}$ symmetry) and c-CC$^{13}$CH$_2$ ($C_s$ symmetry) have been observed in the 1-3 mm band toward the low-mass star-forming region L1527. We have detected 7, 3, and 6 lines of c-C$_3$H$_2$, c-$^{13}$CCCH$_2$ , and c-CC$^{13}$CH$_2$, respectively, with the Nobeyama 45 m telescope, and 34, 6, and 13 lines, respectively, with the IRAM 30 m telescope, where 7, 2, and 2 transitions, respectively, are observed with the both telescopes. With these data, we have evaluated the column densities of the normal and $^{13}$C isotopic species. The [c-C$_3$H$_2$]/[c-$^{13}$CCCH$_2$] ratio is determined to be $310\pm80$, while the [c-C$_3$H$_2$]/[c-CC$^{13}$CH$_2$] ratio is determined to be $61\pm11$. The [c-C$_3$H$_2$]/[c-$^{13}$CCCH$_2$] and [c-C$_3$H$_2$]/[c-CC$^{13}$CH$_2$] ratios expected from the elemental $^{12}$C/$^{13}$C ratio are 60-70 and 30-35, respectively, where the latter takes into account the statistical factor of 2 for the two equivalent carbon atoms in c-C$_3$H$_2$. Hence, this observation further confirms the dilution of the $^{13}$C species in carbon-chain molecules and their related molecules, which are thought to originate from the dilution of $^{13}$C$^+$ in the gas-phase C$^+$ due to the isotope exchange reaction: $\mathrm{^{13}C^++CO\rightarrow{}^{13}CO+C^+}$. Moreover, the abundances of the two $^{13}$C isotopic species are different from each other. The ratio of c-$\mathrm{^{13}CCCH_2}$ species relative to c-$\mathrm{CC^{13}CH_2}$ is determined to be $0.20\pm0.05$. If $^{13}$C were randomly substituted for the three carbon atoms, the [c-$\mathrm{^{13}CCCH_2}$]/[c-$\mathrm{CC^{13}CH_2}$] ratio would be 0.5. Hence, the observed ratio indicates that c-$\mathrm{CC^{13}CH_2}$ exists more favorably. Possible origins of the different abundances are discussed.
AI Key Findings
Get AI-generated insights about this paper's methodology, results, and significance.
Paper Details
PDF Preview
Key Terms
Citation Network
Current paper (gray), citations (green), references (blue)
Display is limited for performance on very large graphs.
Similar Papers
Found 4 papersDeuteration of c-C$_3$H$_2$ towards the pre-stellar core L1544
P. Caselli, F. Alves, S. Spezzano et al.
| Title | Authors | Year | Actions |
|---|
Comments (0)