Publication
Metrics
AI Quick Summary
This paper tests abundance matching (AM) models for predicting stellar-to-total mass relations in galaxies using the SHIVir survey data. The study finds that AM models accurately reproduce the observed stellar-to-halo mass relation's slope and normalization, but exhibit a significantly larger scatter compared to observations, especially for massive galaxies.
Paper Preview
Abstract
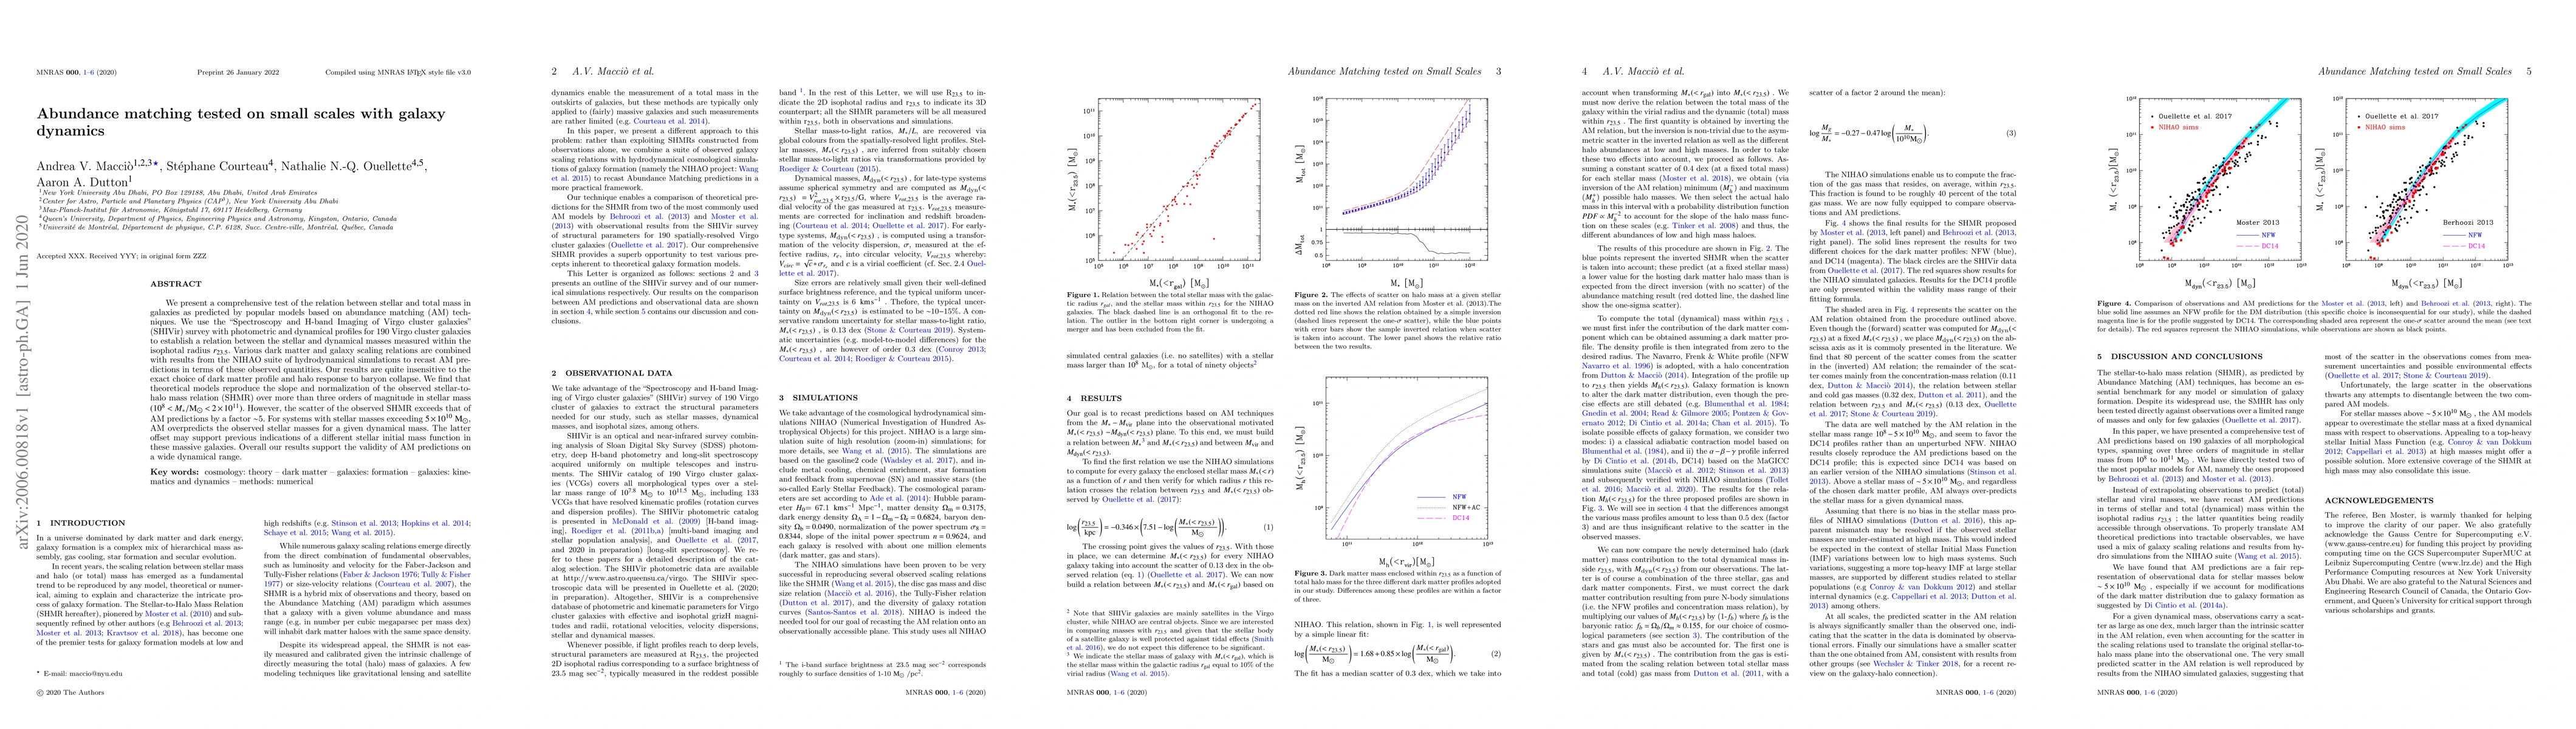
We present a comprehensive test of the relation between stellar and total mass in galaxies as predicted by popular models based on abundance matching (AM) techniques. We use the ``Spectroscopy and H-band Imaging of Virgo cluster galaxies'' (SHIVir) survey with photometric and dynamical profiles for 190 Virgo cluster galaxies to establish a relation between the stellar and dynamical masses measured within the isophotal radius $r_{23.5}$. Various dark matter and galaxy scaling relations are combined with results from the NIHAO suite of hydrodynamical simulations to recast AM predictions in terms of these observed quantities. Our results are quite insensitive to the exact choice of dark matter profile and halo response to baryon collapse. We find that theoretical models reproduce the slope and normalization of the observed stellar-to-halo mass relation (SHMR) over more than three orders of magnitude in stellar mass $(10^8 < M_*/M_{\odot} < 2 \times 10^{11})$. However, the scatter of the observed SHMR exceeds that of AM predictions by a factor $\sim$5. For systems with stellar masses exceeding $5 \times 10^{10}~M_{\odot}$, AM overpredicts the observed stellar masses for a given dynamical mass. The latter offset may support previous indications of a different stellar initial mass function in these massive galaxies. Overall our results support the validity of AM predictions on a wide dynamical range.
AI Key Findings
Get AI-generated insights about this paper's methodology, results, significance, and more — seven facets brought into focus.
Impact
Paper Details
Authors
PDF Preview
Key Terms
Citation Network
Current paper (gray), citations (green), references (blue)
Display is limited for performance on very large graphs.
Discussion 0