AC2 -- Towards Understanding Architectural Changes in Rapid Releases
Publication
Metrics
AI Quick Summary
The paper introduces AC2, a visualization tool for examining architectural changes in Python projects undergoing rapid releases. AC2 uses call and collaboration graphs to provide four views for comparing architectural alterations between two releases, aiding developers in understanding complexity and changes over time.
Paper Preview
Abstract
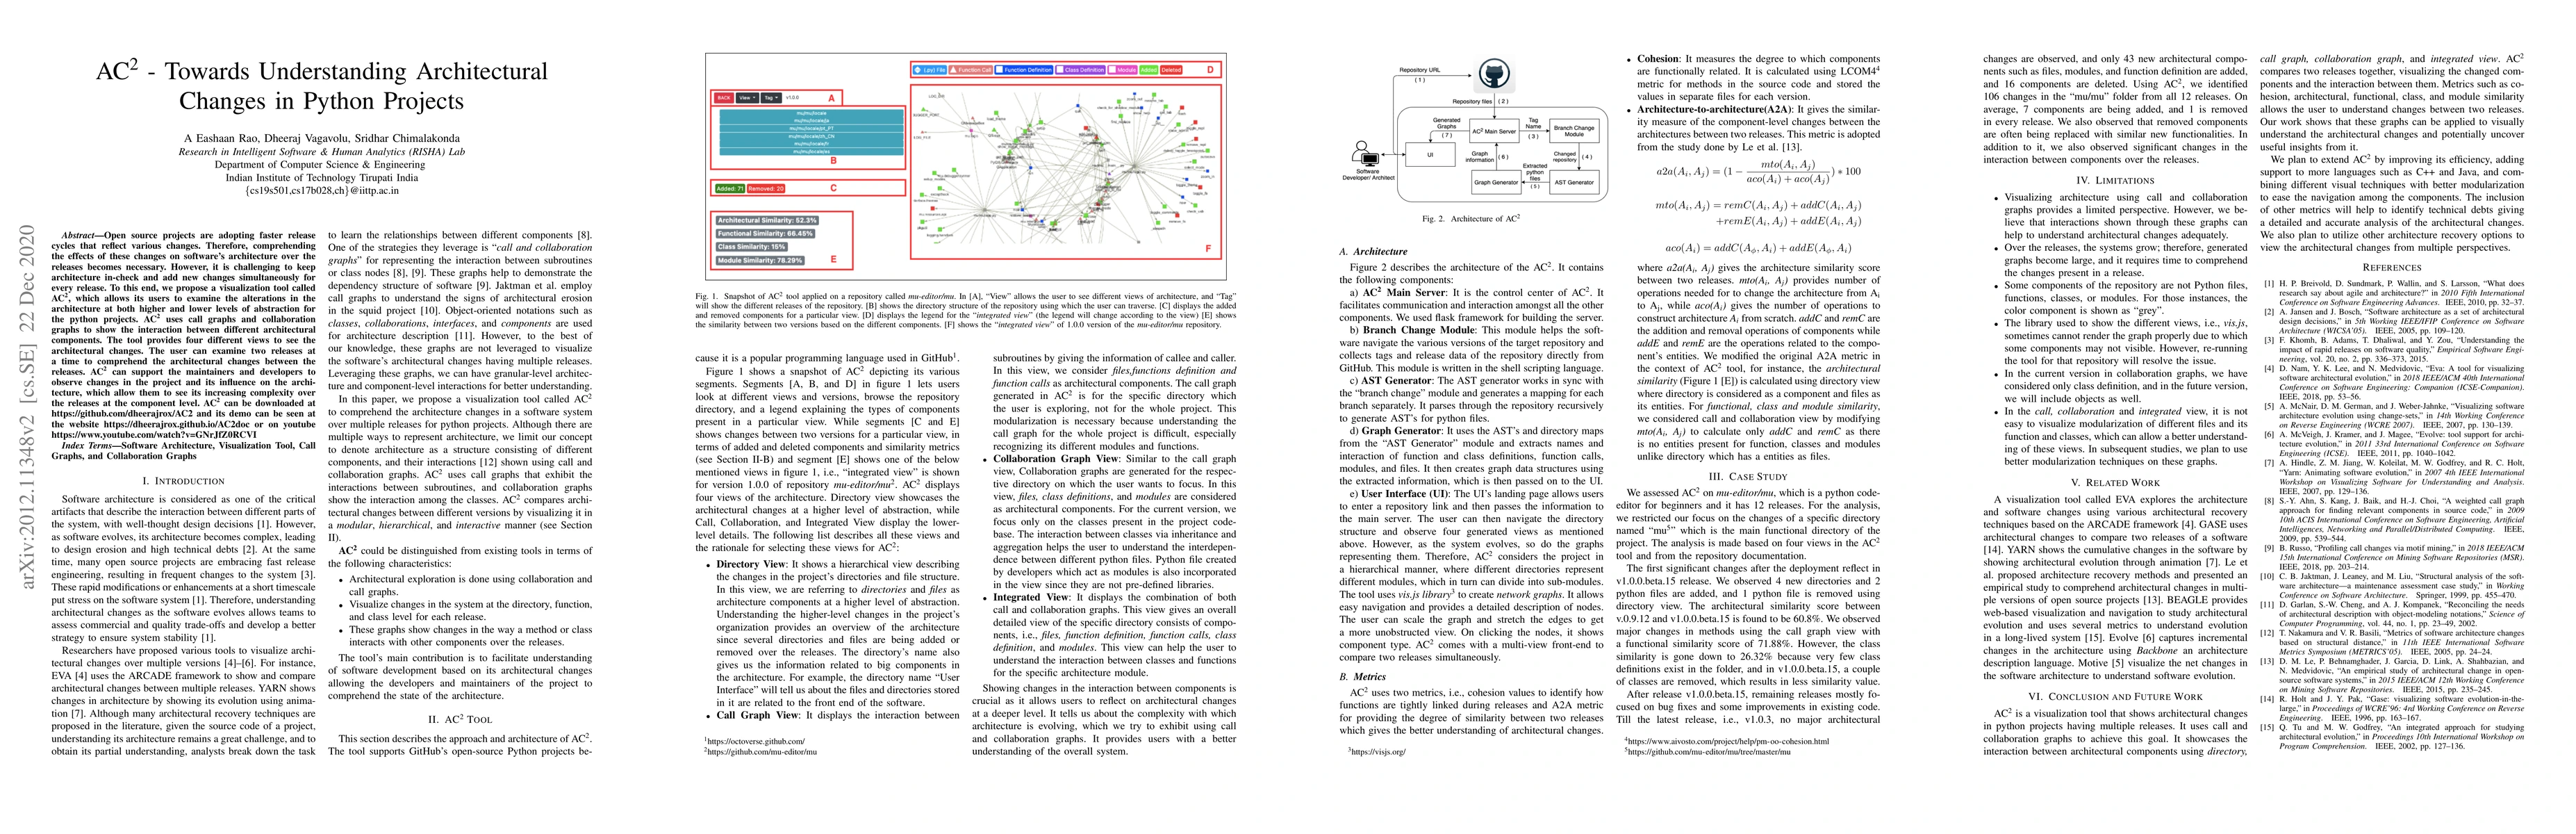
Open source projects are adopting faster release cycles that reflect various changes. Therefore, comprehending the effects of these changes on software's architecture over the releases becomes necessary. However, it is challenging to keep architecture in-check and add new changes simultaneously for every release. To this end, we propose a visualization tool called AC2, which allows its users to examine the alterations in the architecture at both higher and lower levels of abstraction for the python projects. AC2 uses call graphs and collaboration graphs to show the interaction between different architectural components. The tool provides four different views to see the architectural changes. The user can examine two releases at a time to comprehend the architectural changes between the releases. AC2 can support the maintainers and developers to observe changes in the project and its influence on the architecture, which allow them to see its increasing complexity over the releases at the component level. AC2 can be downloaded at https://github.com/dheerajrox/AC2 and its demo can be seen at the website https://dheerajrox.github.io/AC2doc or on youtube https://www.youtube.com/watch?v=GNrJfZ0RCVI
AI Key Findings
Get AI-generated insights about this paper's methodology, results, significance, and more — seven facets brought into focus.
Impact
Paper Details
Authors
PDF Preview
Key Terms
Citation Network
Current paper (gray), citations (green), references (blue)
Display is limited for performance on very large graphs.
Discussion 0