Publication
Metrics
AI Quick Summary
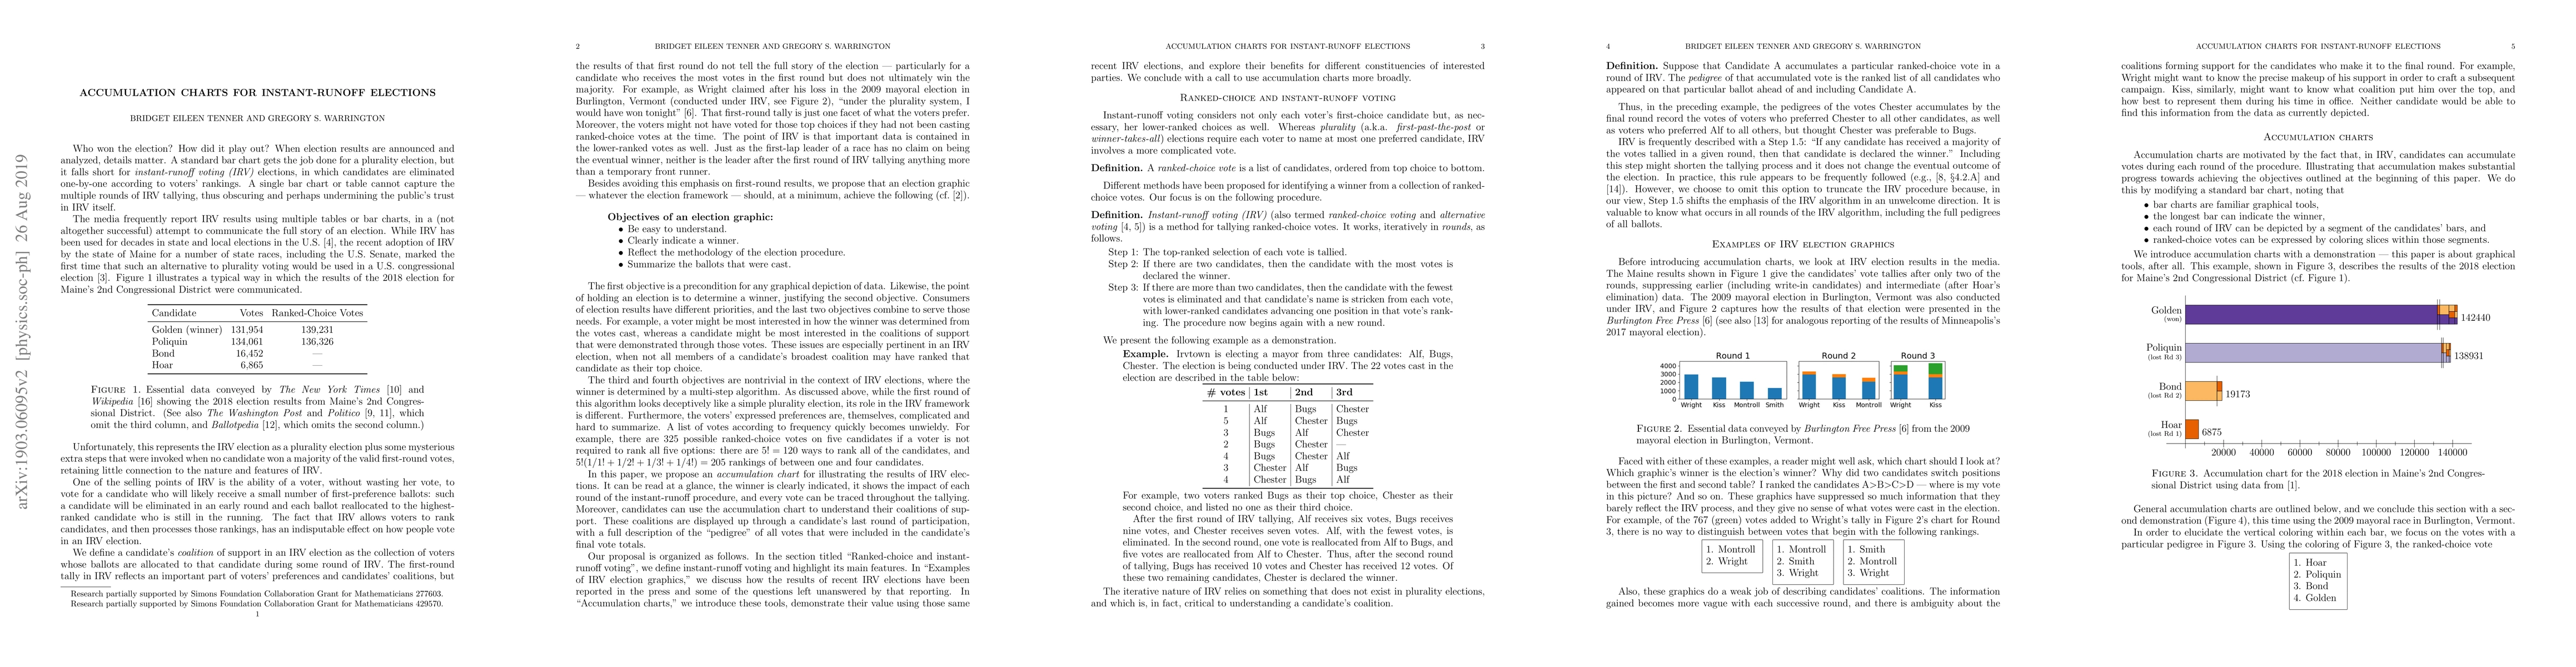
This paper introduces an "accumulation chart" to visualize instant-runoff voting results, offering a clear, easy-to-understand format that highlights the winner, illustrates the instant-runoff process, and summarizes voter preferences along with candidate coalitions.
Paper Preview
Abstract
We propose a new graphical format for instant-runoff voting election results. We call this proposal an "accumulation chart." This model, a modification of standard bar charts, is easy to understand, clearly indicates the winner, depicts the instant-runoff algorithm, and summarizes the votes cast. Moreover, it includes the pedigree of each accumulated vote and gives a clear depiction of candidates' coalitions.
AI Key Findings
Get AI-generated insights about this paper's methodology, results, significance, and more — seven facets brought into focus.
Impact
Paper Details
Authors
PDF Preview
Key Terms
Citation Network
Current paper (gray), citations (green), references (blue)
Display is limited for performance on very large graphs.
Discussion 0