Summary
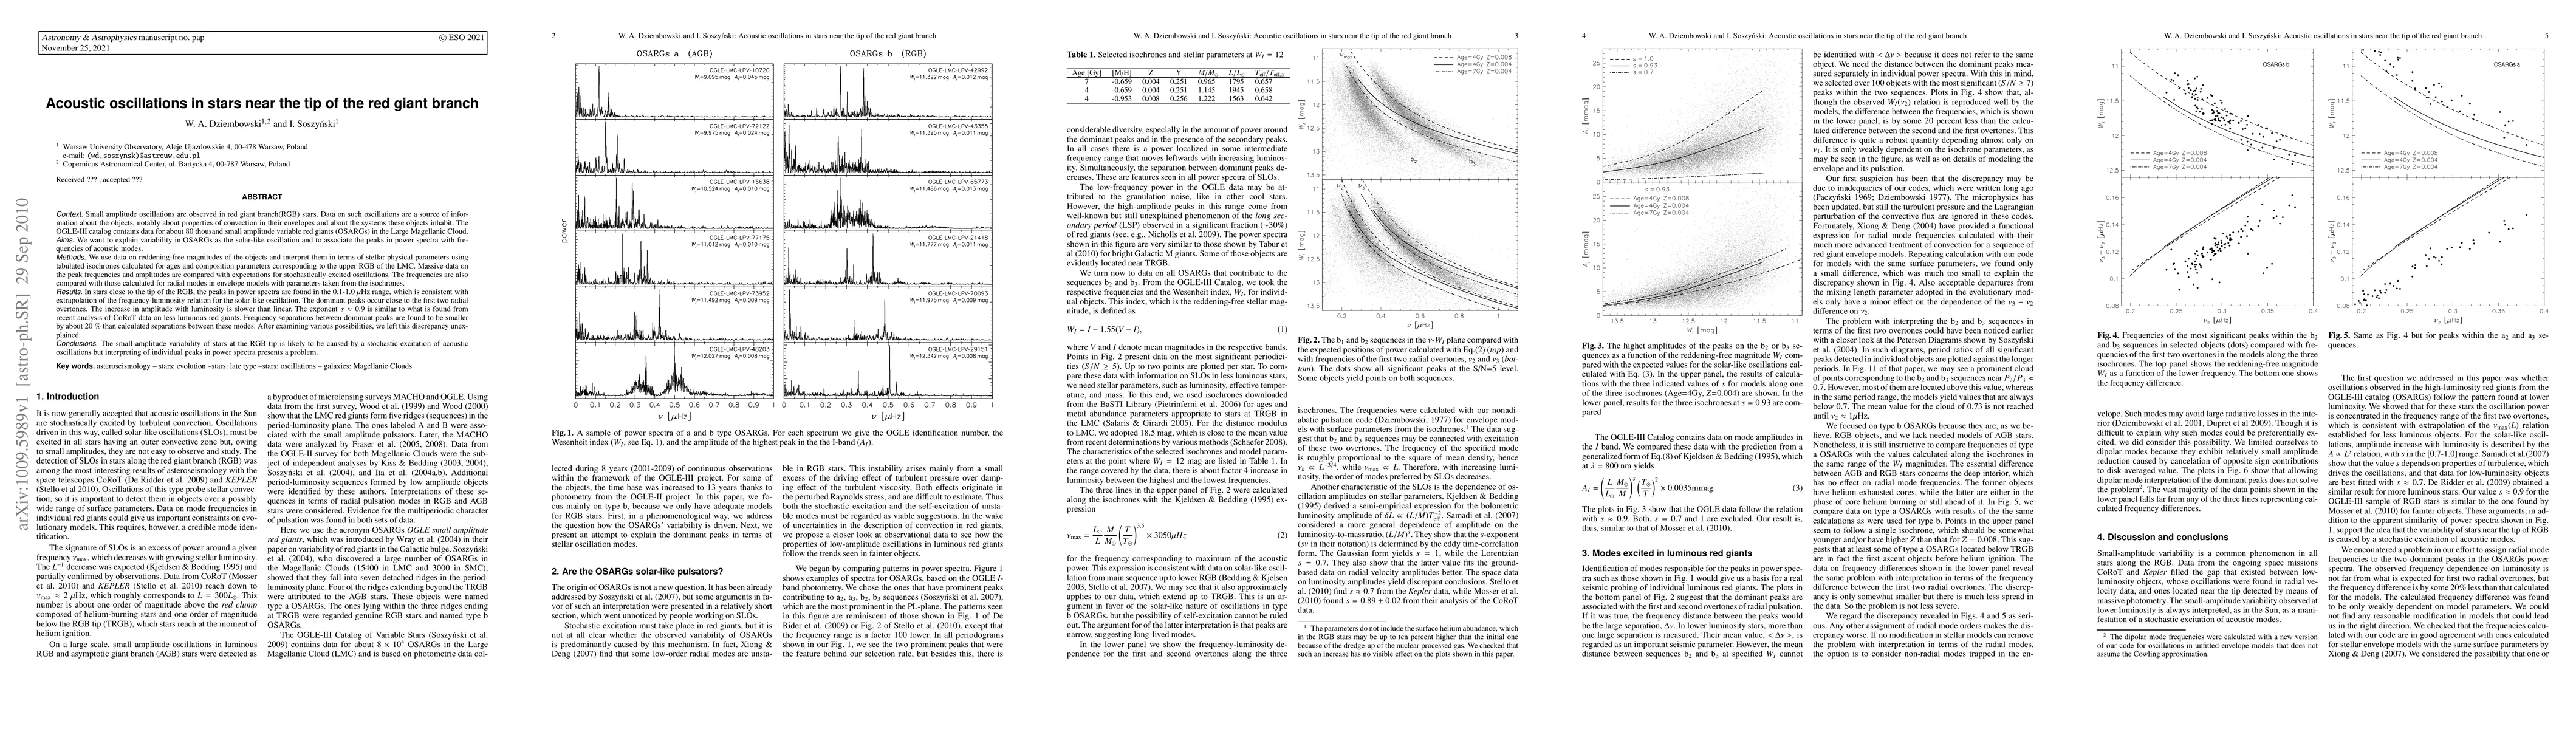
Small amplitude oscillations are observed in red giant branch (RGB) stars. Data on such oscillations are a source of information about the objects, notably about properties of convection in their envelopes and about the systems these objects inhabit. The OGLE-III catalog contains data for about 80 thousand small amplitude variable red giants (OSARGs) in the Large Magellanic Cloud. We want to explain variability in OSARGs as the solar-like oscillation and to associate the peaks in power spectra with frequencies of acoustic modes. We use data on reddening-free magnitudes of the objects and interpret them in terms of stellar physical parameters using tabulated isochrones calculated for ages and composition parameters corresponding to the upper RGB of the LMC. Massive data on the peak frequencies and amplitudes are compared with expectations for stochastically excited oscillations. The frequencies are also compared with those calculated for radial modes in envelope models with parameters taken from the isochrones. In stars close to the tip of the RGB, the peaks in power spectra are found in the 0.1-1.0 $\mu$Hz range, which is consistent with extrapolation of the frequency-luminosity relation for the solar-like oscillation. The dominant peaks occur close to the first two radial overtones. The increase in amplitude with luminosity is slower than linear. The exponent s=0.9 is similar to what is found from recent analysis of CoRoT data on less luminous red giants. Frequency separations between dominant peaks are found to be smaller by about 20% than calculated separations between these modes. After examining various possibilities, we left this discrepancy unexplained. The small amplitude variability of stars at the RGB tip is likely to be caused by a stochastic excitation of acoustic oscillations, but interpreting of individual peaks in power spectra presents a problem.
AI Key Findings
Get AI-generated insights about this paper's methodology, results, and significance.
Paper Details
PDF Preview
Key Terms
Citation Network
Current paper (gray), citations (green), references (blue)
Display is limited for performance on very large graphs.
Similar Papers
Found 4 papers| Title | Authors | Year | Actions |
|---|
Comments (0)