Adapting to Skew: Imputing Spatiotemporal Urban Data with 3D Partial Convolutions and Biased Masking
Publication
Metrics
AI Quick Summary
This paper adapts image inpainting techniques to fill large, irregular missing regions in urban spatiotemporal data, addressing skew due to population density patterns. The authors propose 3D partial convolutions and biased masking to improve imputation accuracy, demonstrating effectiveness using NYC taxi and bikeshare datasets.
Paper Preview
Abstract
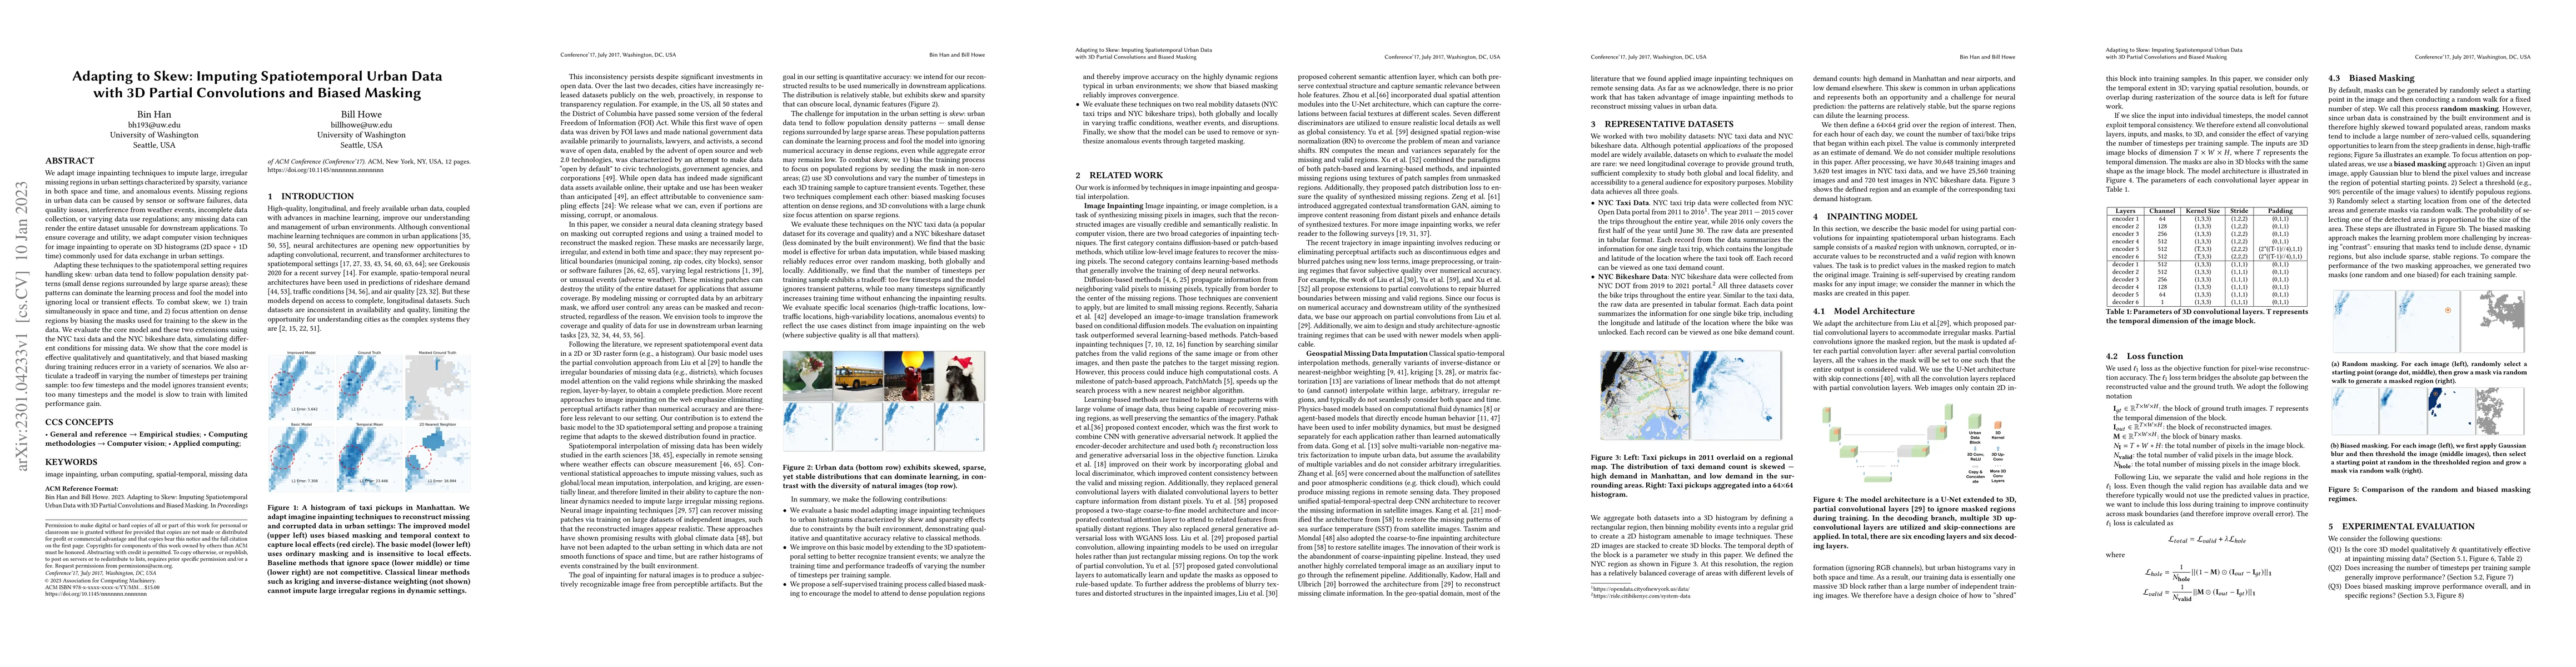
We adapt image inpainting techniques to impute large, irregular missing regions in urban settings characterized by sparsity, variance in both space and time, and anomalous events. Missing regions in urban data can be caused by sensor or software failures, data quality issues, interference from weather events, incomplete data collection, or varying data use regulations; any missing data can render the entire dataset unusable for downstream applications. To ensure coverage and utility, we adapt computer vision techniques for image inpainting to operate on 3D histograms (2D space + 1D time) commonly used for data exchange in urban settings. Adapting these techniques to the spatiotemporal setting requires handling skew: urban data tend to follow population density patterns (small dense regions surrounded by large sparse areas); these patterns can dominate the learning process and fool the model into ignoring local or transient effects. To combat skew, we 1) train simultaneously in space and time, and 2) focus attention on dense regions by biasing the masks used for training to the skew in the data. We evaluate the core model and these two extensions using the NYC taxi data and the NYC bikeshare data, simulating different conditions for missing data. We show that the core model is effective qualitatively and quantitatively, and that biased masking during training reduces error in a variety of scenarios. We also articulate a tradeoff in varying the number of timesteps per training sample: too few timesteps and the model ignores transient events; too many timesteps and the model is slow to train with limited performance gain.
AI Key Findings
Get AI-generated insights about this paper's methodology, results, significance, and more — seven facets brought into focus.
Impact
Paper Details
Authors
PDF Preview
Key Terms
Citation Network
Current paper (gray), citations (green), references (blue)
Display is limited for performance on very large graphs.
Discussion 0