Publication
Metrics
AI Quick Summary
This paper proposes ADSketch, an interpretable and adaptive anomaly detection method for online service systems based on pattern sketching. ADSketch identifies groups of anomalous metric patterns for immediate recognition of underlying issues and employs an adaptive learning algorithm to handle new patterns. Experimental results show superior performance compared to existing methods and successful industrial deployment.
Paper Preview
Abstract
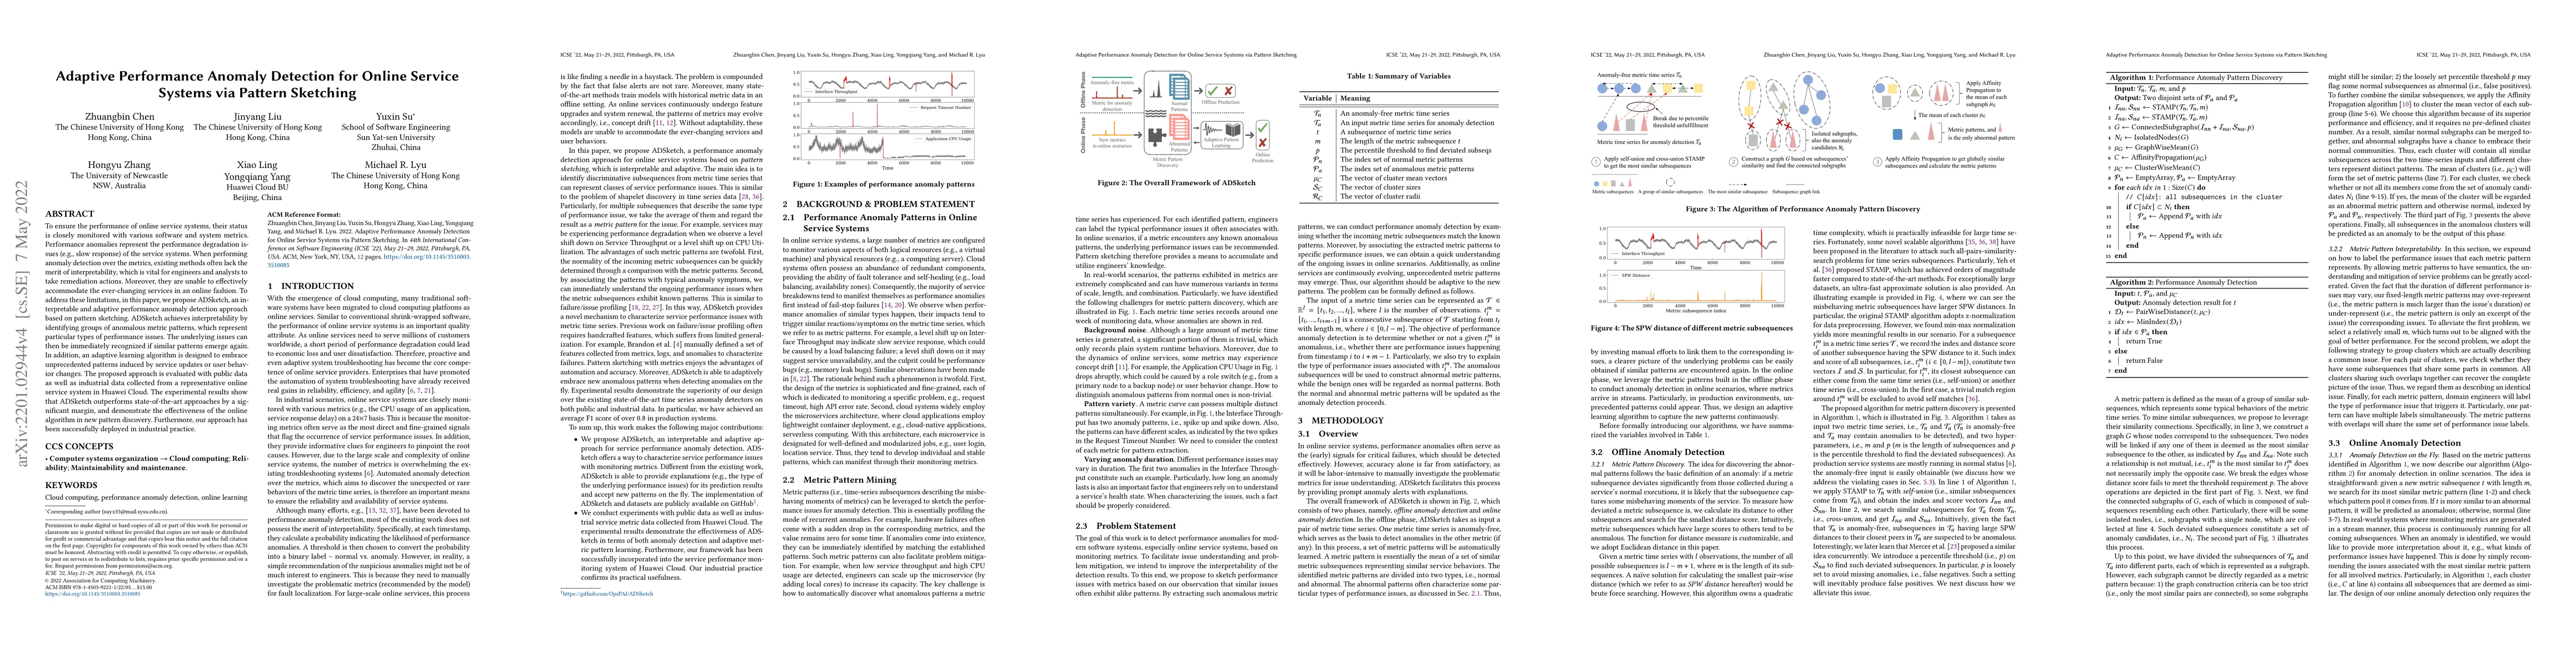
To ensure the performance of online service systems, their status is closely monitored with various software and system metrics. Performance anomalies represent the performance degradation issues (e.g., slow response) of the service systems. When performing anomaly detection over the metrics, existing methods often lack the merit of interpretability, which is vital for engineers and analysts to take remediation actions. Moreover, they are unable to effectively accommodate the ever-changing services in an online fashion. To address these limitations, in this paper, we propose ADSketch, an interpretable and adaptive performance anomaly detection approach based on pattern sketching. ADSketch achieves interpretability by identifying groups of anomalous metric patterns, which represent particular types of performance issues. The underlying issues can then be immediately recognized if similar patterns emerge again. In addition, an adaptive learning algorithm is designed to embrace unprecedented patterns induced by service updates or user behavior changes. The proposed approach is evaluated with public data as well as industrial data collected from a representative online service system in Huawei Cloud. The experimental results show that ADSketch outperforms state-of-the-art approaches by a significant margin, and demonstrate the effectiveness of the online algorithm in new pattern discovery. Furthermore, our approach has been successfully deployed in industrial practice.
AI Key Findings
Get AI-generated insights about this paper's methodology, results, significance, and more — seven facets brought into focus.
Impact
Paper Details
Authors
PDF Preview
Key Terms
Citation Network
Current paper (gray), citations (green), references (blue)
Display is limited for performance on very large graphs.
Discussion 0