Adding color: Visualization of energy landscapes in spin glasses
Publication
Metrics
AI Quick Summary
Researchers developed a visualization tool to analyze energy landscapes in spin glasses, revealing distinct features among different models, including the number of minima, barrier height, and distribution of minimum states.
Paper Preview
Abstract
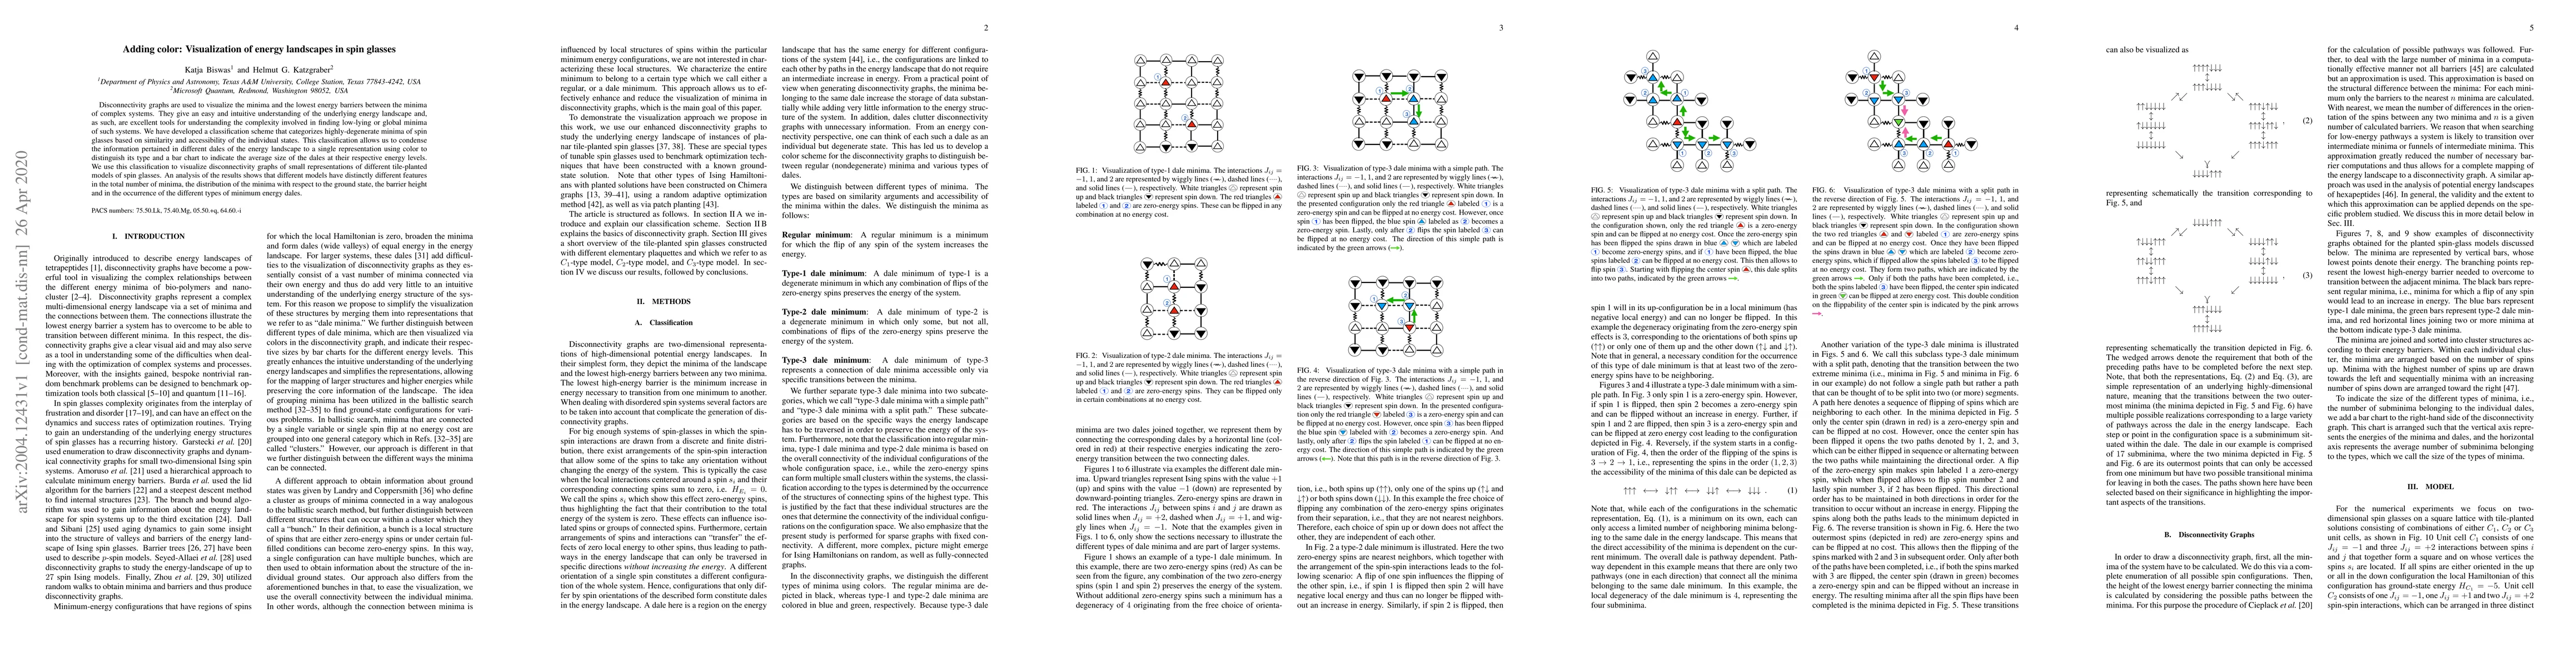
Disconnectivity graphs are used to visualize the minima and the lowest energy barriers between the minima of complex systems. They give an easy and intuitive understanding of the underlying energy landscape and, as such, are excellent tools for understanding the complexity involved in finding low-lying or global minima of such systems. We have developed a classification scheme that categorizes highly-degenerate minima of spin glasses based on similarity and accessibility of the individual states. This classification allows us to condense the information pertained in different dales of the energy landscape to a single representation using color to distinguish its type and a bar chart to indicate the average size of the dales at their respective energy levels. We use this classification to visualize disconnectivity graphs of small representations of different tile-planted models of spin glasses. An analysis of the results shows that different models have distinctly different features in the total number of minima, the distribution of the minima with respect to the ground state, the barrier height and in the occurrence of the different types of minimum energy dales.
AI Key Findings
Get AI-generated insights about this paper's methodology, results, significance, and more — seven facets brought into focus.
Impact
Paper Details
Authors
PDF Preview
Key Terms
Citation Network
Current paper (gray), citations (green), references (blue)
Display is limited for performance on very large graphs.
Discussion 0