Adding Visibility to Visibility Graphs: Weighting Visibility Analysis with Attenuation Coefficients
Publication
Metrics
AI Quick Summary
Researchers developed a new method to weigh visibility graphs with weather conditions like rain, fog, and snow, revealing the impact of reduced visibility on urban design.
Paper Preview
Abstract
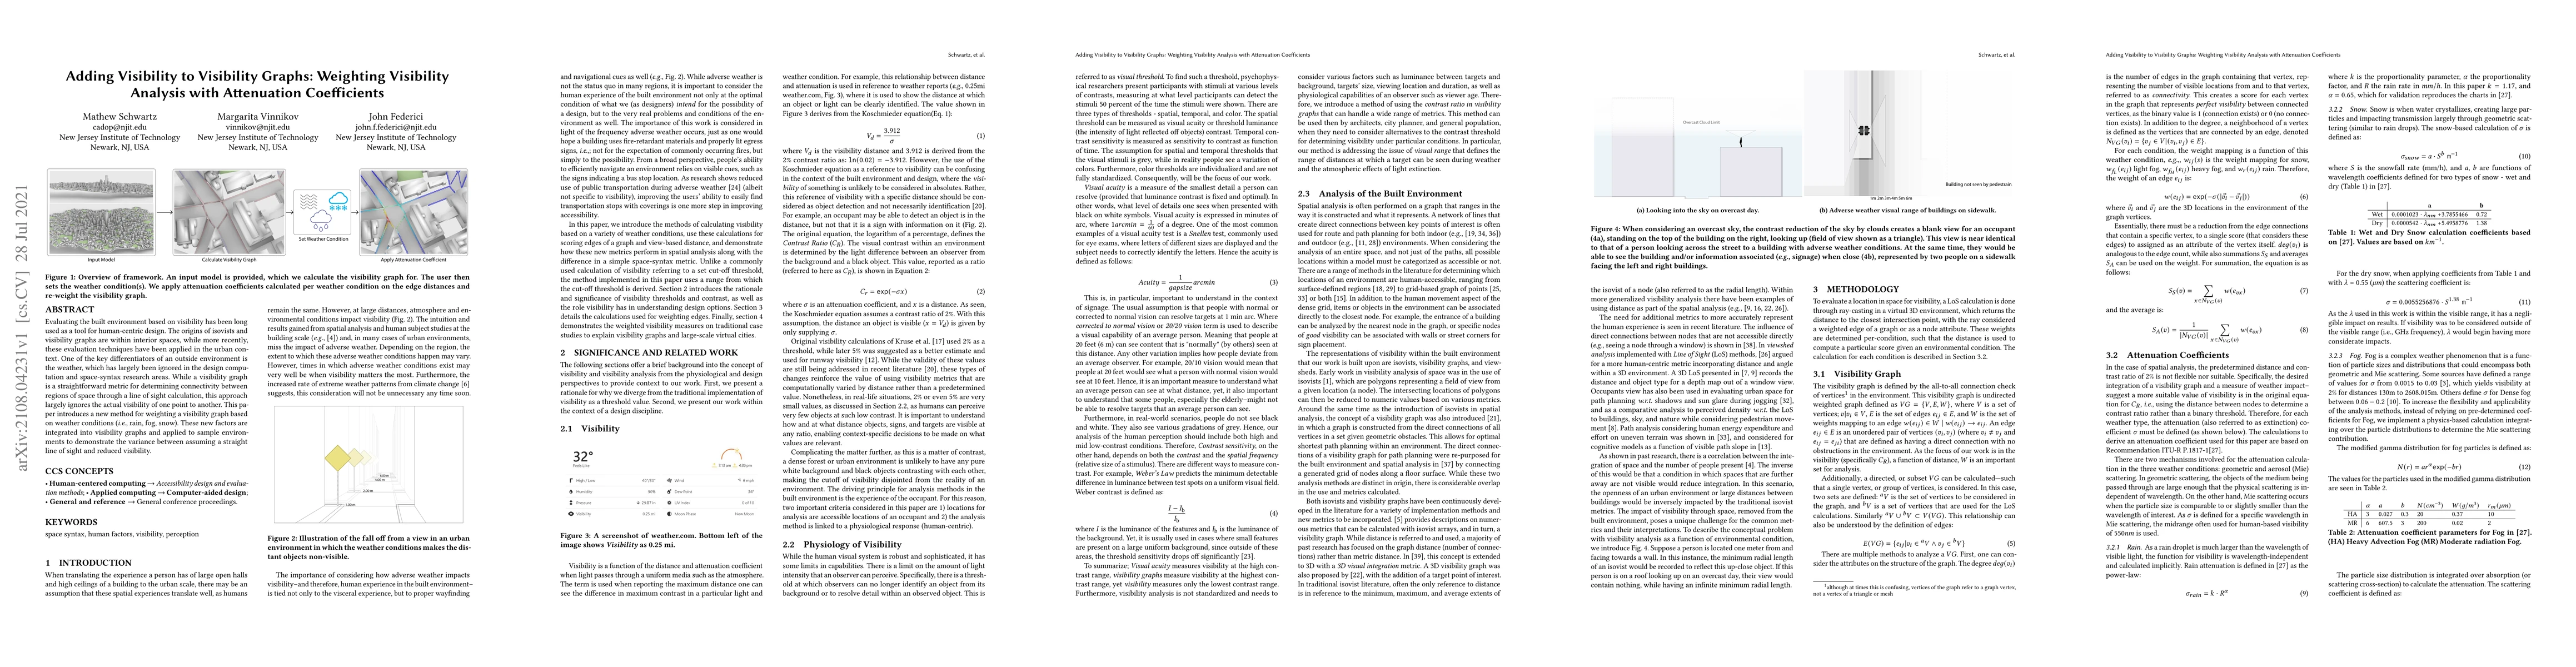
Evaluating the built environment based on visibility has been long used as a tool for human-centric design. The origins of isovists and visibility graphs are within interior spaces, while more recently, these evaluation techniques have been applied in the urban context. One of the key differentiators of an outside environment is the weather, which has largely been ignored in the design computation and space-syntax research areas. While a visibility graph is a straightforward metric for determining connectivity between regions of space through a line of sight calculation, this approach largely ignores the actual visibility of one point to another. This paper introduces a new method for weighting a visibility graph based on weather conditions (i.e. rain, fog, snow). These new factors are integrated into visibility graphs and applied to sample environments to demonstrate the variance between assuming a straight line of sight and reduced visibility.
AI Key Findings
Get AI-generated insights about this paper's methodology, results, significance, and more — seven facets brought into focus.
Impact
Paper Details
Authors
PDF Preview
Key Terms
Citation Network
Current paper (gray), citations (green), references (blue)
Display is limited for performance on very large graphs.
Discussion 0