Addressing Population Heterogeneity for HIV Incidence Estimation Based on Recency Test
Publication
Metrics
AI Quick Summary
This paper proposes a framework for estimating HIV incidence across different target populations, addressing potential heterogeneity, and incorporating HIV subtype effects. The methods show excellent performance through simulations and data applications, with future work focusing on sensitivity analysis and improvements.
Paper Preview
Abstract
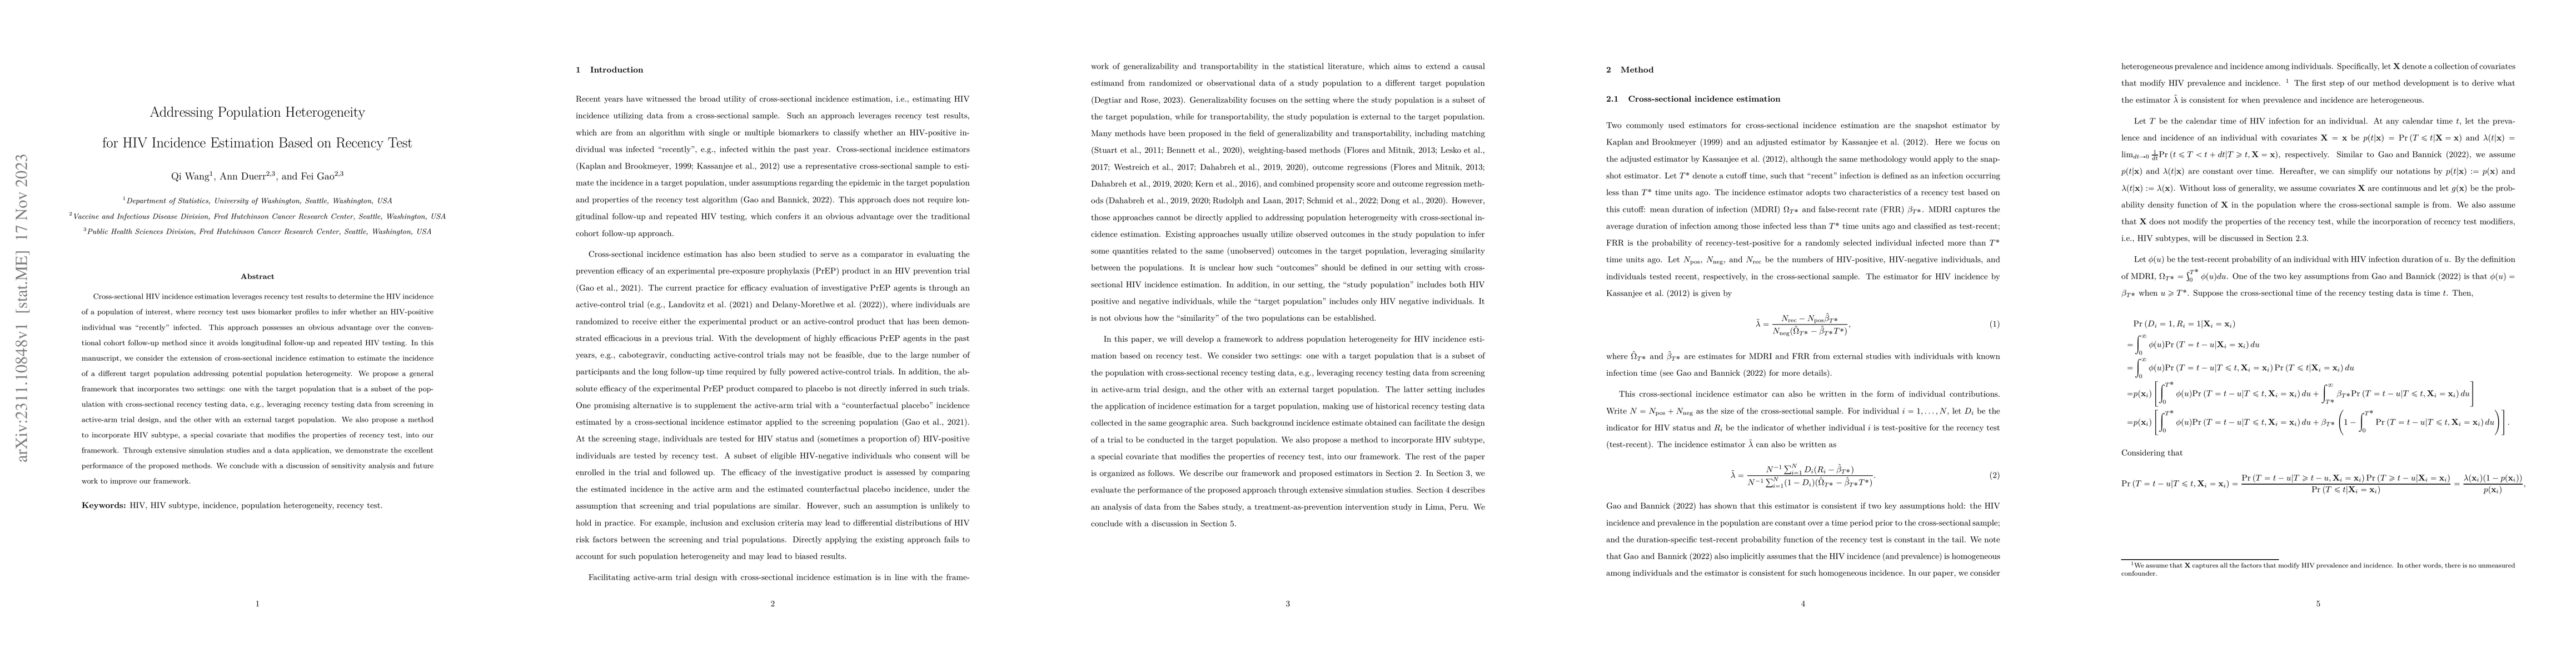
Cross-sectional HIV incidence estimation leverages recency test results to determine the HIV incidence of a population of interest, where recency test uses biomarker profiles to infer whether an HIV-positive individual was "recently" infected. This approach possesses an obvious advantage over the conventional cohort follow-up method since it avoids longitudinal follow-up and repeated HIV testing. In this manuscript, we consider the extension of cross-sectional incidence estimation to estimate the incidence of a different target population addressing potential population heterogeneity. We propose a general framework that incorporates two settings: one with the target population that is a subset of the population with cross-sectional recency testing data, e.g., leveraging recency testing data from screening in active-arm trial design, and the other with an external target population. We also propose a method to incorporate HIV subtype, a special covariate that modifies the properties of recency test, into our framework. Through extensive simulation studies and a data application, we demonstrate the excellent performance of the proposed methods. We conclude with a discussion of sensitivity analysis and future work to improve our framework.
AI Key Findings
Get AI-generated insights about this paper's methodology, results, significance, and more — seven facets brought into focus.
Paper Details
Authors
PDF Preview
Key Terms
Related Papers
No references found for this paper.
Discussion 0