adjustedCurves: Estimating Confounder-Adjusted Survival Curves in R
Publication
Metrics
AI Quick Summary
The adjustedCurves R package estimates and plots confounder-adjusted survival curves using various methods to account for confounding, providing confidence intervals and additional metrics. It unifies diverse methods and demonstrates its utility with publicly available breast cancer data.
Paper Preview
Abstract
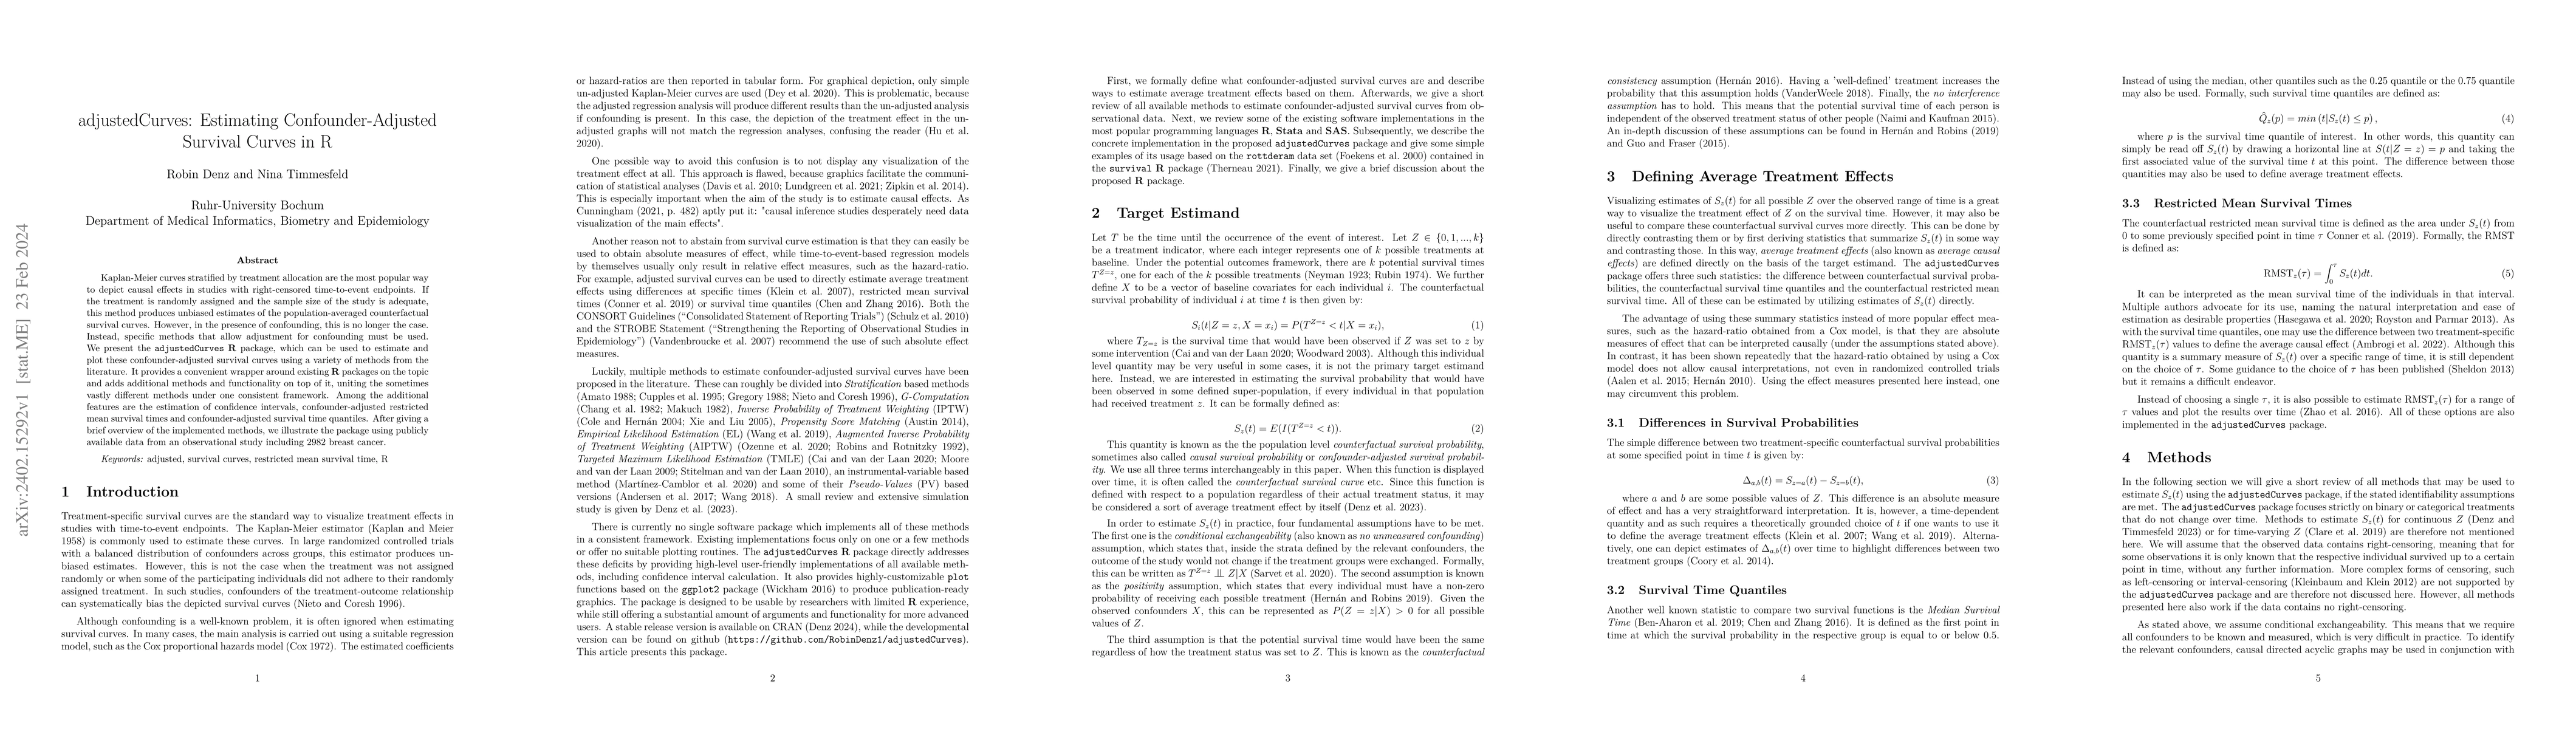
Kaplan-Meier curves stratified by treatment allocation are the most popular way to depict causal effects in studies with right-censored time-to-event endpoints. If the treatment is randomly assigned and the sample size of the study is adequate, this method produces unbiased estimates of the population-averaged counterfactual survival curves. However, in the presence of confounding, this is no longer the case. Instead, specific methods that allow adjustment for confounding must be used. We present the adjustedCurves R package, which can be used to estimate and plot these confounder-adjusted survival curves using a variety of methods from the literature. It provides a convenient wrapper around existing R packages on the topic and adds additional methods and functionality on top of it, uniting the sometimes vastly different methods under one consistent framework. Among the additional features are the estimation of confidence intervals, confounder-adjusted restricted mean survival times and confounder-adjusted survival time quantiles. After giving a brief overview of the implemented methods, we illustrate the package using publicly available data from an observational study including 2982 breast cancer.
AI Key Findings
Get AI-generated insights about this paper's methodology, results, significance, and more — seven facets brought into focus.
Impact
Paper Details
Authors
PDF Preview
Key Terms
Citation Network
Current paper (gray), citations (green), references (blue)
Display is limited for performance on very large graphs.
Discussion 0