Background
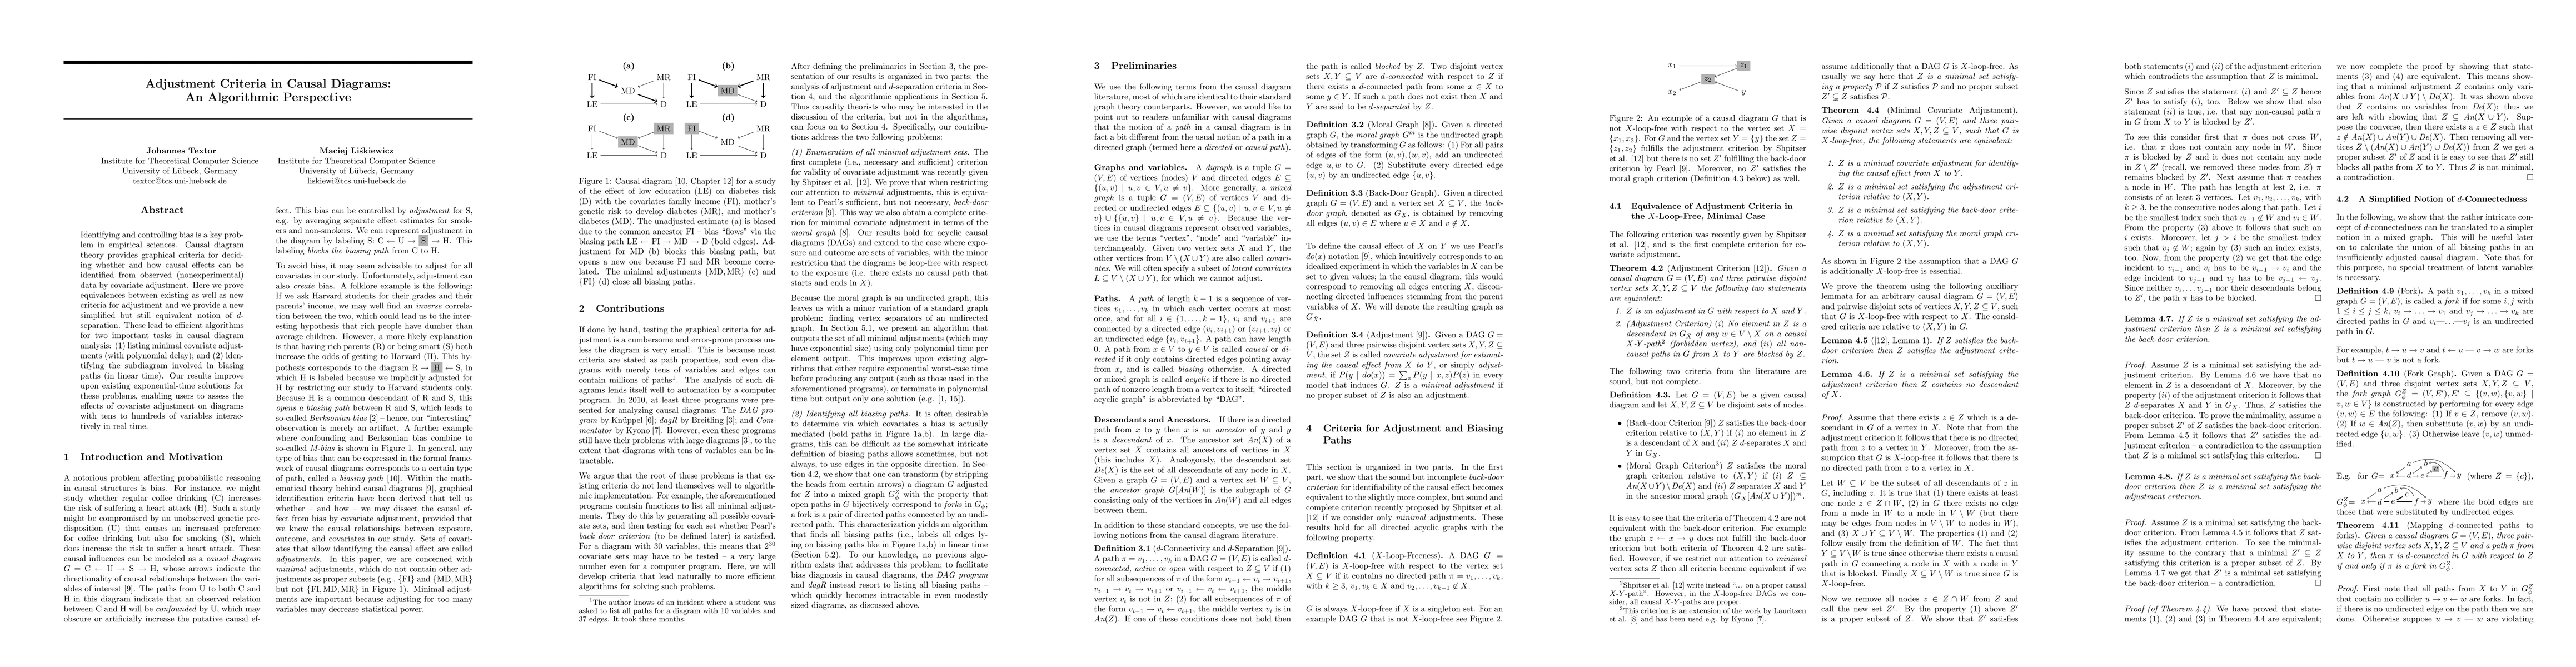
Causal diagrams (DAGs) are a formal language for representing causal relationships between variables. Adjustment, d-separation, and moral graphs are central concepts used to decide when and how covariates Z can be used to estimate the causal effect of X on Y from observational data. Classic criteria (such as Pearl's back-door criterion) tell us which covariates to condition on, but applying these criteria by hand becomes error-prone as diagrams grow. Moreover, naive adjustment can introduce new biases (e.g., Berkson bias or M-bias), so identifying a valid, minimal adjustment set is a delicate task.
The paper situates itself at the intersection of causal-graph theory and algorithm design, with a focus on turning graphical criteria into scalable procedures. It revisits the back-door, moral-graph, and newer criteria (as developed by Shpitser et al.) and seeks equivalences that are amenable to efficient computation, especially for minimal adjustment sets.
Problem / Research Question
The central problems are twofold: (i) how to enumerate all minimal adjustment sets efficiently (potentially exponential in number but with polynomial delay per solution), and (ii) how to identify all biasing paths that remain after a given adjustment. The authors aim to make these tasks tractable for graphs with tens to hundreds of variables, and to provide a unified, algorithmic treatment that leverages well-known graph-theoretic methods.
A key axis is the X-loop-free restriction, which ensures certain pathological structures do not occur and enables the equivalence results that underpin the algorithms. Under this condition, the authors connect adjustment to minimal separators in a moral graph and show that minimal solutions can be found with manageable computational effort.
Innovation / Contribution
The core theoretical contribution is a set of equivalence results that tie minimal covariate adjustment to more classical graph problems. Specifically, for X-loop-free DAGs, the following are shown to be equivalent for minimal Z: (i) Z is a covariate adjustment, (ii) Z satisfies the adjustment criterion, (iii) Z satisfies the back-door criterion, and (iv) Z satisfies the moral-graph criterion. This unifies multiple criteria under a common, minimality-focused framework and explains why existing methods can be interchangeable in the minimal case.
Algorithmically, the paper makes two major advances. First, it provides a polynomial-delay algorithm to enumerate all minimal d-separators in the ancestor moral graph after adjusting for X, by reducing to the undirected separator problem and extending Takata’s approach to handle forbidden vertices. This yields an O(n3) preprocessing phase and O(n3) time per solution, making complete enumerations practical for moderately large diagrams.
Second, it introduces a linear-time method to identify all biasing paths by mapping the problem to forks in a fork graph G_Z^φ. This leverages a generalization of Eppstein’s disjoint-path ideas and introduces bottleneck numbers to certify the existence of X–Y forks through a mixed-graph construction. The overall result is a scalable, linear-time pathway to diagnose where bias is transmitted in insufficiently adjusted diagrams.
Methodology / Approach
The authors begin by formalizing the adjustment problem in terms of X, Y, Z and by adopting the X-loop-free constraint. They then prove equivalences between the adjustment, back-door, and moral-graph criteria for minimal Z (Theorem 4.4) and show how these reductions can be leveraged algorithmically.
For enumeration, they transform the problem to listing minimal X–Y separators in a derived graph G_L that excludes forbidden variables L (with a construction that preserves the relevant separators). They then adapt a polynomial-delay separator-listing algorithm to the moral-graph setting, achieving the stated time bounds (Theorem 5.3).
For bias-path identification, the authors introduce the fork graph G_Zφ, derived from the original DAG by removing edges from Z and turning certain directed edges into undirected ones. They prove a mapping between d-connectivity in the original graph and fork-structures in G_Zφ (Theorem 4.11), and then provide a linear-time algorithm (Theorem 5.5) based on a generalized bottleneck-number approach (extending Eppstein’s ideas) to locate all X–Y forks in the fork graph. The combination yields a practical pipeline from a causal diagram to a complete bias-path diagnosis.
Experiments / Evaluation
The work reported in the excerpt is primarily theoretical and algorithmic, focusing on formal guarantees and complexity bounds. It emphasizes that the algorithms enable interactive analysis for diagrams of realistic size and mentions the practical deployment in the DAGitty tool to support researchers. There is no description of large-scale empirical experiments, benchmark suites, or user studies within the provided text. The claimed improvements are expressed as polynomial-delay guarantees, linear-time bias-path identification, and real-time applicability to modestly large graphs.
Key Results
Key results include: (i) an equivalence between adjustment criteria in X-loop-free DAGs for minimal Z (Theorem 4.4), (ii) a polynomial-delay algorithm to list all minimal d-separators after adjusting for X with O(n3) preprocessing and O(n3) per output (Theorem 5.3), (iii) a linear-time algorithm to identify all biasing paths via forks in the fork graph (Theorem 5.5), and (iv) a constructive procedure to map d-connected paths to forks (Theorem 4.11). The practical upshot is that researchers can enumerate all minimal adjustments and diagnose bias paths efficiently, enabling real-time interaction for diagrams of nontrivial size, and underpinning the DAGitty tool’s capabilities.
Practical Applications
Practically, the results translate into scalable tools for causal-diagram analysis. In particular, the equivalences reduce adjustment checking to standard graph-separator problems; the polynomial-delay enumeration makes it feasible to present all minimal adjustment sets to a user without forcing a combinatorial stall; and the linear-time bias-path identification provides a direct mechanism to highlight exactly which covariates contribute to bias in an insufficiently adjusted diagram. The work underpins DAGitty, an online platform that allows researchers to explore and reason about causal structures interactively and to design studies with more reliable adjustment strategies.
Limitations & Considerations
The central limitations arise from the assumptions required for the equivalences and algorithms. The minimal-case equivalences hold under X-loop-freeness; extending the results to more general DAGs (or cyclic/more complex structures) remains unclear. The analysis presumes fully specified graphs with observed variables and does not address measurement error, latent-variable uncertainties beyond the “forbidden” handling in the construction, or robustness to graph misspecification. While the asymptotic claims are strong, the constants and practical performance in very large or dense graphs are not detailed in the excerpt. Finally, empirical validation on real-world datasets, sensitivity analyses to graph misspecification, and integration with broader identification strategies beyond back-door (e.g., front-door) remain open directions.
Discussion 0