Background
The study analyzes the trajectory of machine learning research in China by tapping into the CNKI database, focusing on CSSCI-indexed papers. The data cover publications from 2007 to 2017 and are filtered to papers whose titles include the term “machine learning” within the Information Technology category. The primary analytical instrument is CiteSpace, a visualization tool used to generate knowledge graphs that depict institutional collaborations, keyword co-occurrences, co-citation structures, and research frontiers. This setup enables a structured, visual assessment of the field’s development, major actors, and thematic shifts.
Problem / Research Question
The central question is how to characterize the development of machine learning research in China over a decade in terms of (i) who is publishing and collaborating, (ii) what topics are being pursued and how they cluster, and (iii) what frontiers are emerging at different times. The goal is to move beyond mere publication tallies to a richer, graph-based understanding of the field’s ecosystem, including institutional influence, collaboration networks, and topic dynamics.
Innovation / Contribution
The paper’s innovation lies in applying knowledge-graph visualizations to a national corpus of ML literature to map collaboration networks and topic spaces. It identifies leading institutions, analyzes co-authorship and co-citation patterns, and charts the rise of topics such as sentiment classification and big data within a bibliometric framework. By linking an archival data source (CSSCI) with visualization-driven analysis, the work yields an integrated view of research status, hotspots, and collaboration structures in a way that is actionable for strategy and foresight.
Methodology / Approach
Data are drawn from the CNKI CSSCI corpus using the title-search term “machine learning” within Information Technology, spanning 2007–2017. CiteSpace is used to (a) construct co-authorship, institutional collaboration, and co-citation networks, and (b) generate temporal maps of research frontiers. Specific analytic thresholds are applied to network construction (C/CC/CCV thresholds: (2, 2, 20), (4, 3, 20), (4, 3, 20)) with Top N=30 for network pruning. Outputs include yearly publication trends, institutional distribution figures, co-citation clusters, and frontier maps illustrating topic evolution and interdisciplinarity.
Experiments / Evaluation
The work is descriptive bibliometric analysis rather than experimental evaluation. Evaluation is through qualitative interpretation of visualizations and network metrics (publication counts by year, identification of high-output institutions, co-citation emphasis on information/computer journals, and the emergence of topics over time). The analysis acknowledges that the strength and interpretation of findings depend on dataset scope (CSSCI-only, CNKI-indexed, title-based search) and the visualization tool’s parameters.
Key Results
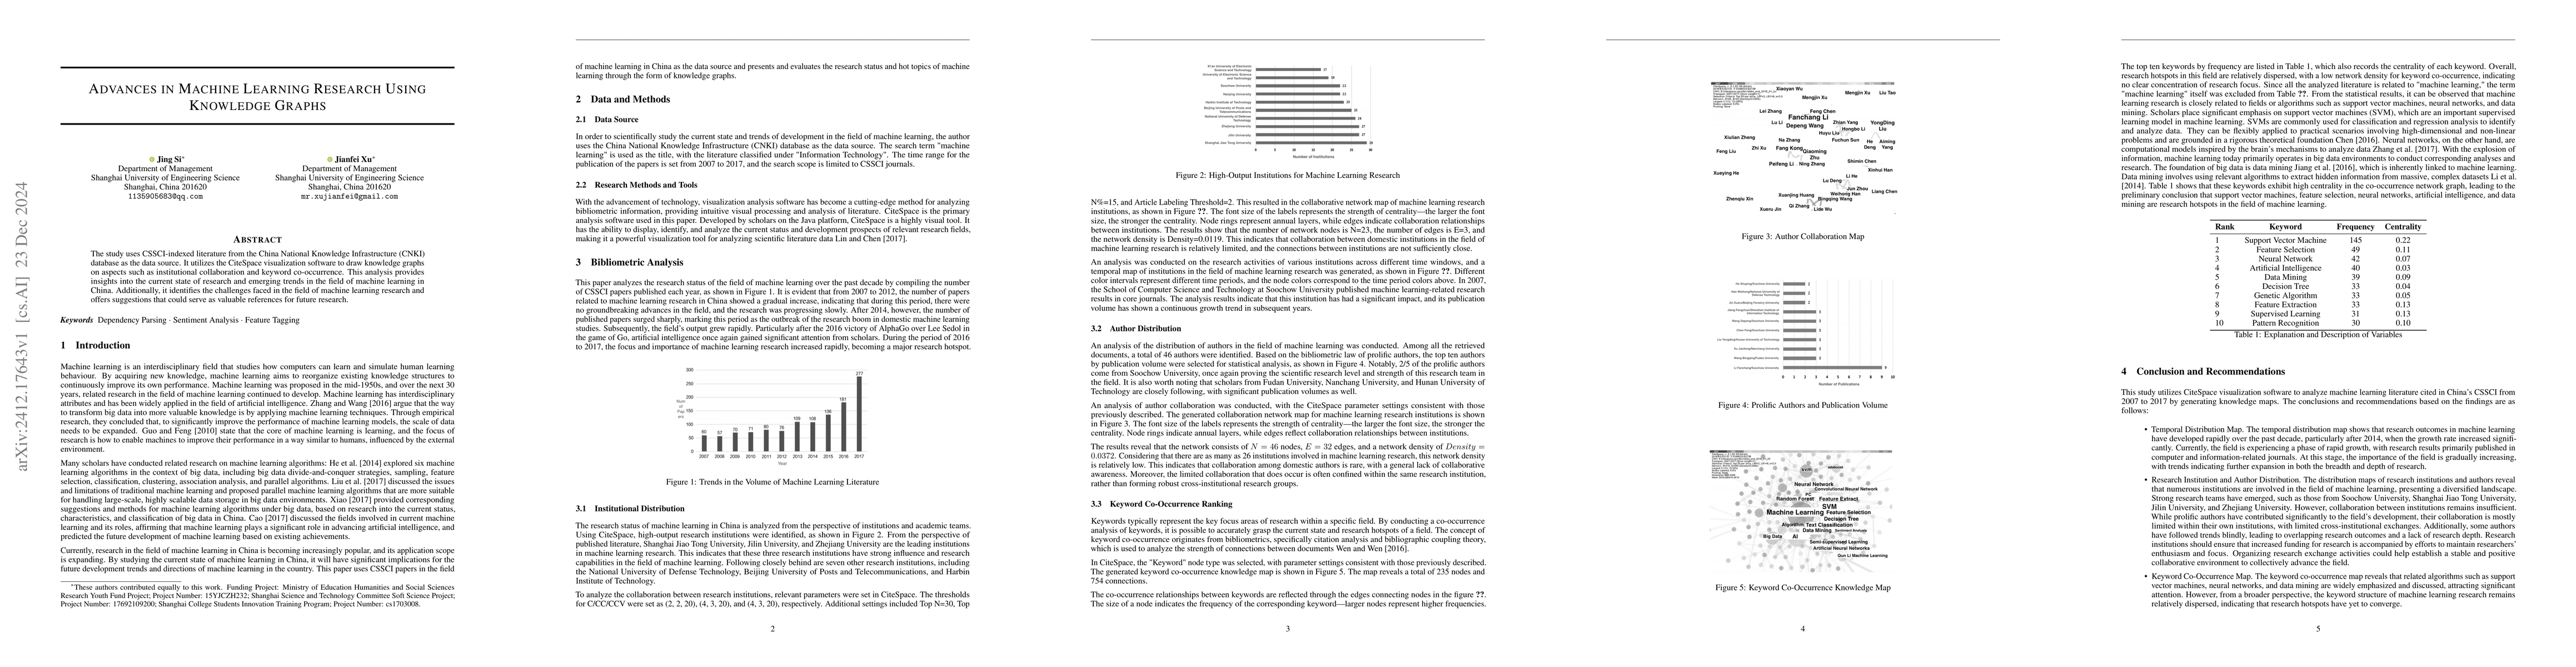
Key findings include: top institutions driving ML research in China—Shanghai Jiao Tong University, Jilin University, Zhejiang University—followed by others like the National University of Defense Technology, Beijing University of Posts and Telecommunications, and Harbin Institute of Technology, indicating concentrated national leadership with wider participation. The publication surge after 2014 and the renewed attention post-AlphaGo in 2016 are highlighted as pivotal inflection points. Co-citation analyses show journals in information and computer science as central publication outlets, underscoring the technical orientation of the field. Frontier maps reveal rising emphasis on sentiment classification and big data, and illustrate the field’s interdisciplinary nature and the rapid adoption of algorithms such as random forests and convolutional neural networks. Knowledge-graph analyses of related domains—e.g., hospital management research—demonstrate the versatility of the method for different subfields.
Practical Applications
For policymakers and funding bodies, the study offers a data-driven lens to identify strategic institutions and collaboration opportunities, guiding resource allocation and program development. For universities and research teams, the knowledge-graph approach helps in forming targeted partnerships, recognizing emerging topics to invest in, and benchmarking against leading institutions. The methodology also provides a replicable blueprint for monitoring evolving research ecosystems in other domains or geographies.
Limitations & Considerations
Key caveats include: (1) dataset scope limited to CSSCI-indexed CNKI papers (2007–2017), which may omit influential work outside CSSCI or beyond CNKI; (2) reliance on title-based query for machine learning, potentially missing relevant papers with peripheral mentions; (3) the use of CiteSpace and chosen thresholds may bias network structure; (4) lack of causal validation linking policy events or funding to observed publication patterns; (5) potential author/name disambiguation and institutional affiliation ambiguities that could affect network accuracy.
Discussion 0