Adventures in Abstraction: Reachability in Hierarchical Drawings
Publication
Metrics
Paper Preview
Abstract
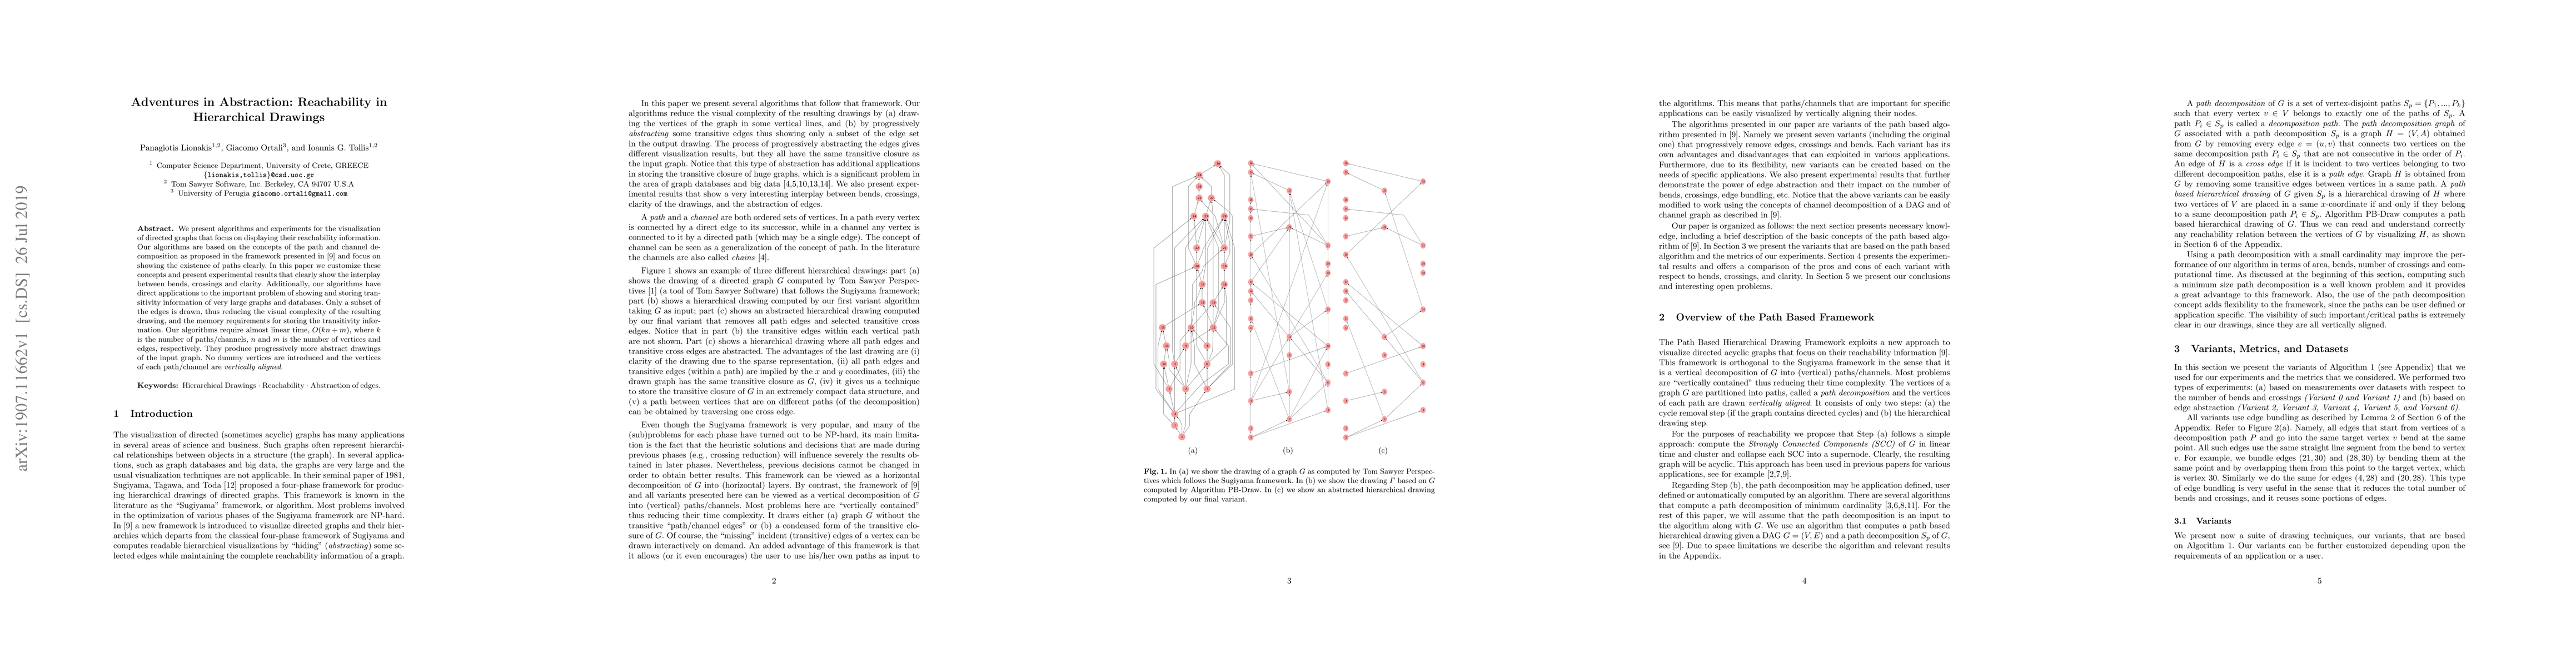
We present algorithms and experiments for the visualization of directed graphs that focus on displaying their reachability information. Our algorithms are based on the concepts of the path and channel decomposition as proposed in the framework presented in GD 2018 (pp. 579-592) and focus on showing the existence of paths clearly. In this paper we customize these concepts and present experimental results that clearly show the interplay between bends, crossings and clarity. Additionally, our algorithms have direct applications to the important problem of showing and storing transitivity information of very large graphs and databases. Only a subset of the edges is drawn, thus reducing the visual complexity of the resulting drawing, and the memory requirements for storing the transitivity information. Our algorithms require almost linear time, $O(kn+m)$, where $k$ is the number of paths/channels, $n$ and $m$ is the number of vertices and edges, respectively. They produce progressively more abstract drawings of the input graph. No dummy vertices are introduced and the vertices of each path/channel are vertically aligned.
AI Key Findings
Get AI-generated insights about this paper's methodology, results, significance, and more — seven facets brought into focus.
Impact
Paper Details
PDF Preview
Key Terms
Citation Network
Current paper (gray), citations (green), references (blue)
Display is limited for performance on very large graphs.
Discussion 0