Summary
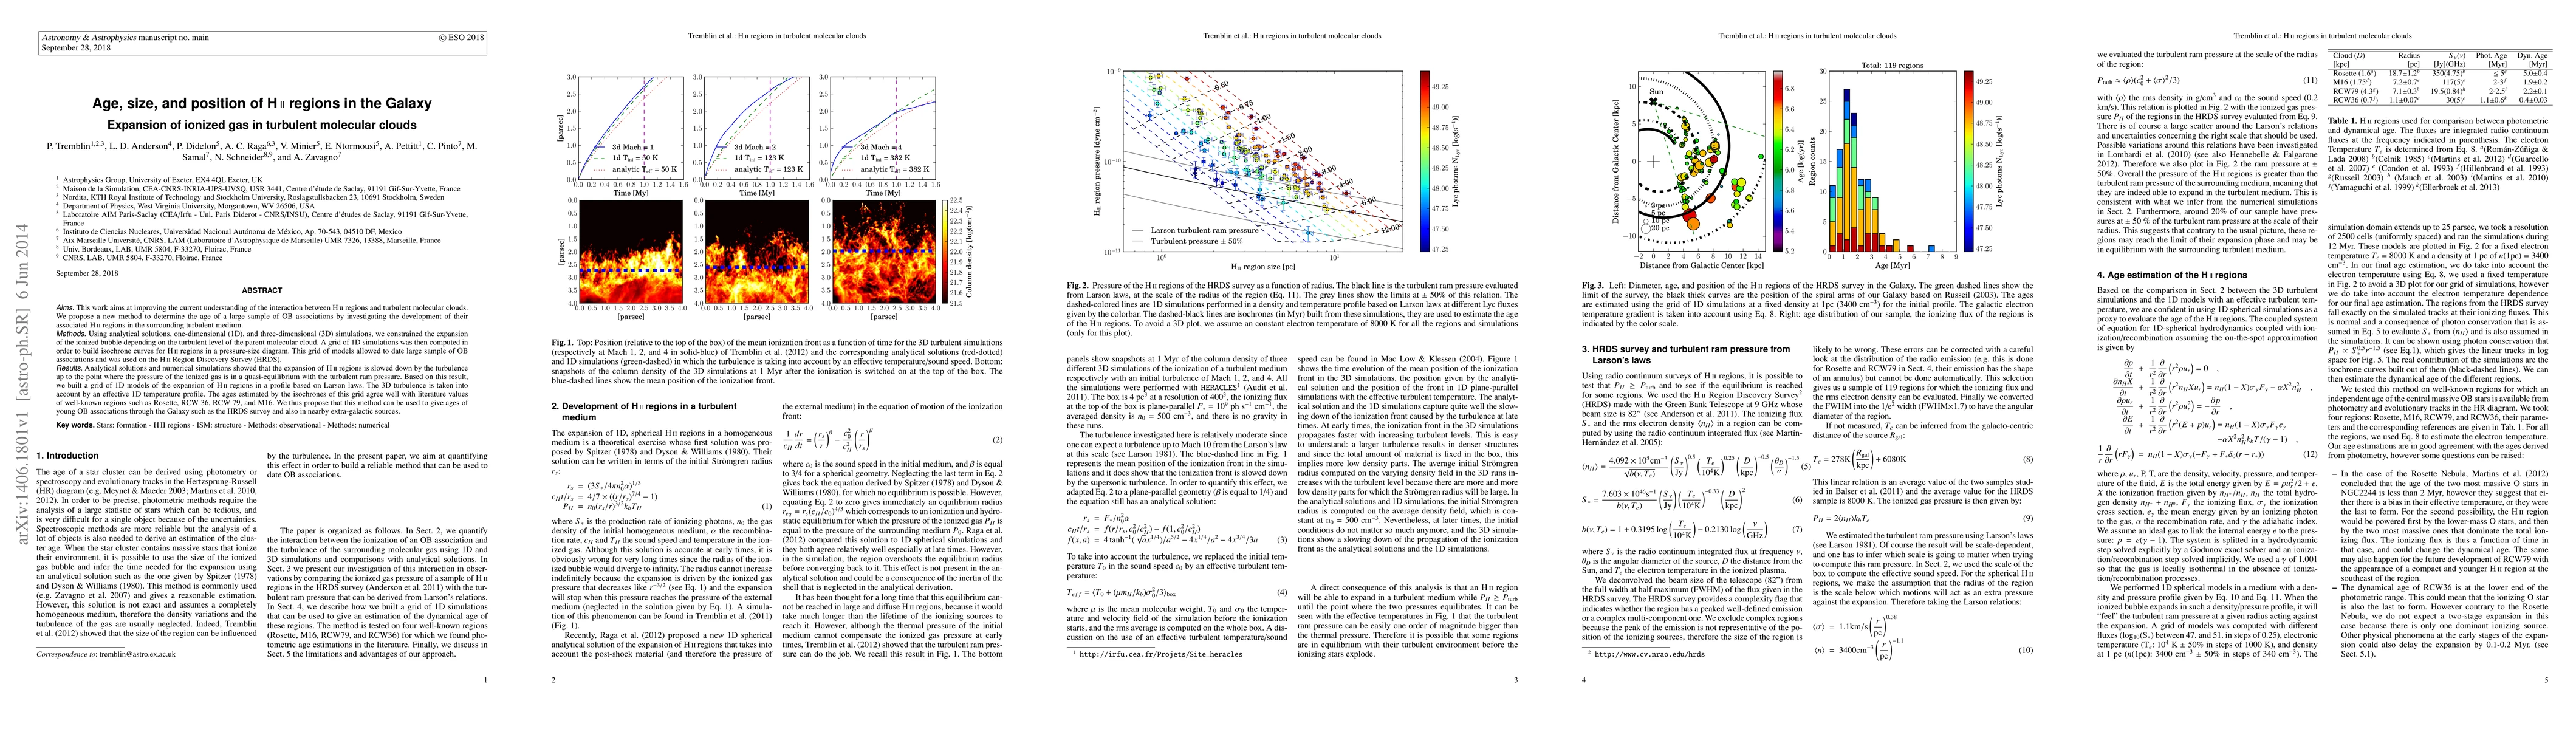
This work aims at improving the current understanding of the interaction between H ii regions and turbulent molecular clouds. We propose a new method to determine the age of a large sample of OB associations by investigating the development of their associated H ii regions in the surrounding turbulent medium. Using analytical solutions, one-dimensional (1D), and three-dimensional (3D) simulations, we constrained the expansion of the ionized bubble depending on the turbulent level of the parent molecular cloud. A grid of 1D simulations was then computed in order to build isochrone curves for H ii regions in a pressure-size diagram. This grid of models allowed to date large sample of OB associations and was used on the H ii Region Discovery Survey (HRDS). Analytical solutions and numerical simulations showed that the expansion of H ii regions is slowed down by the turbulence up to the point where the pressure of the ionized gas is in a quasi-equilibrium with the turbulent ram pressure. Based on this result, we built a grid of 1D models of the expansion of H ii regions in a profile based on Larson laws. The 3D turbulence is taken into account by an effective 1D temperature profile. The ages estimated by the isochrones of this grid agree well with literature values of well-known regions such as Rosette, RCW 36, RCW 79, and M16. We thus propose that this method can be used to give ages of young OB associations through the Galaxy such as the HRDS survey and also in nearby extra-galactic sources.
AI Key Findings
Get AI-generated insights about this paper's methodology, results, and significance.
Paper Details
PDF Preview
Key Terms
Citation Network
Current paper (gray), citations (green), references (blue)
Display is limited for performance on very large graphs.
Similar Papers
Found 4 papers| Title | Authors | Year | Actions |
|---|
Comments (0)