Summary
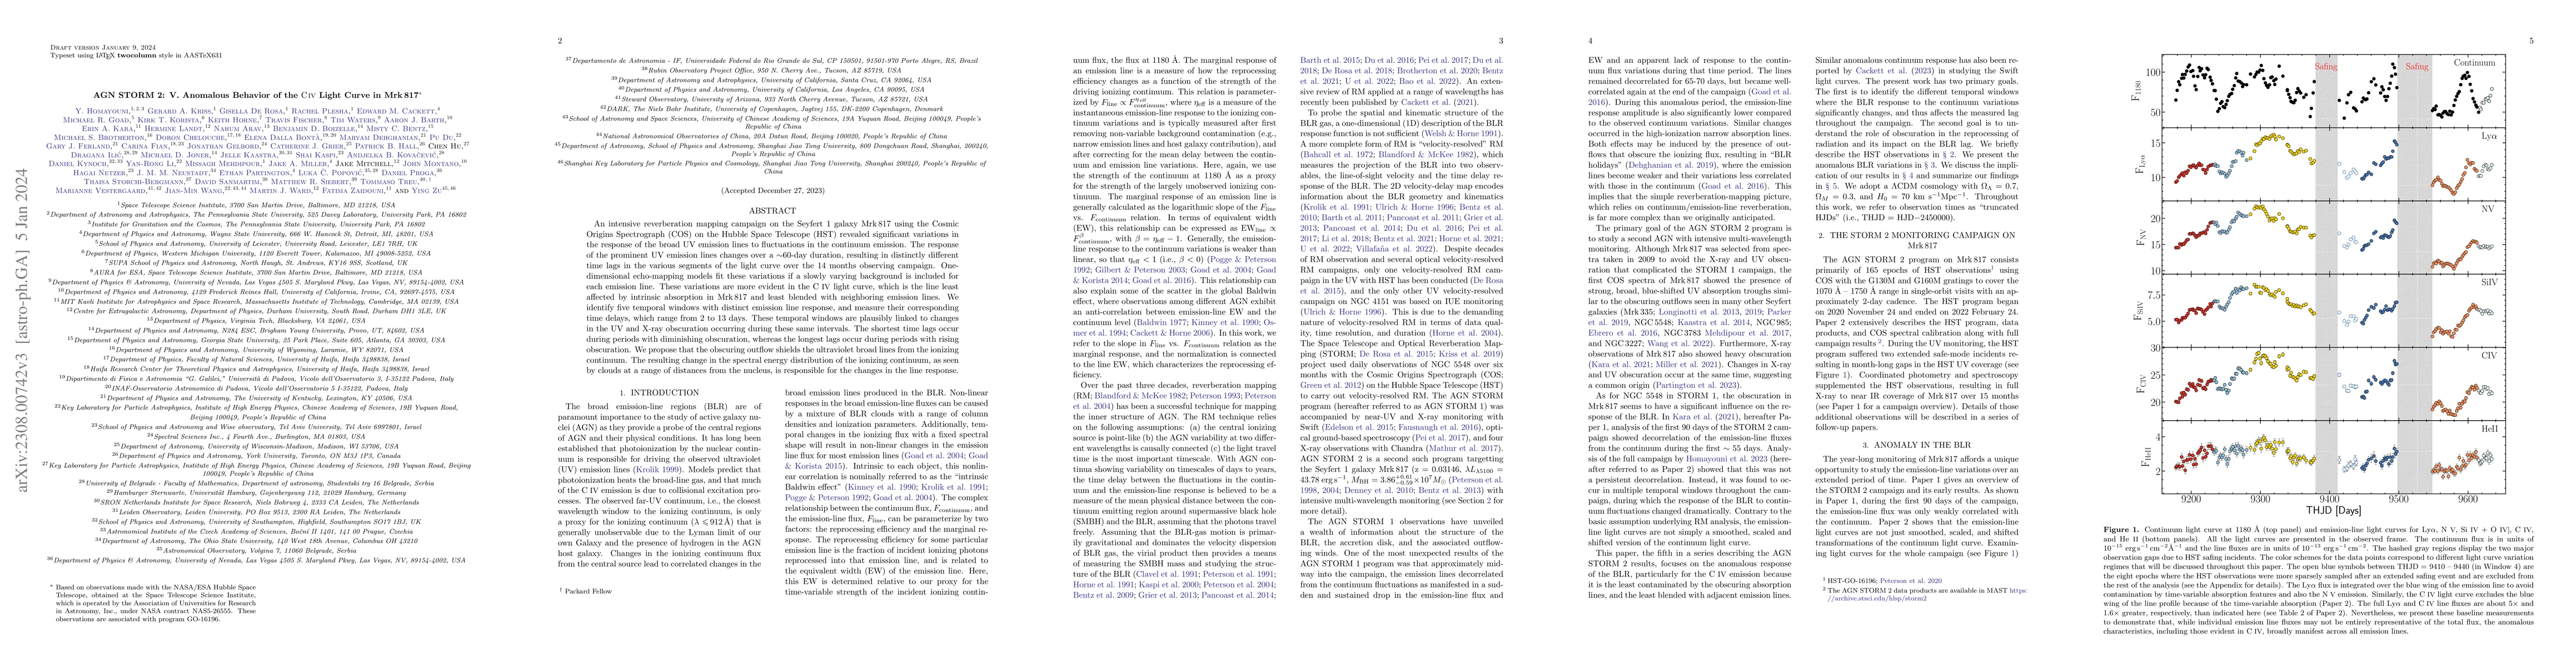
An intensive reverberation mapping campaign on the Seyfert 1 galaxy Mrk817 using the Cosmic Origins Spectrograph (COS) on the Hubble Space Telescope (HST) revealed significant variations in the response of the broad UV emission lines to fluctuations in the continuum emission. The response of the prominent UV emission lines changes over a $\sim$60-day duration, resulting in distinctly different time lags in the various segments of the light curve over the 14 months observing campaign. One-dimensional echo-mapping models fit these variations if a slowly varying background is included for each emission line. These variations are more evident in the CIV light curve, which is the line least affected by intrinsic absorption in Mrk817 and least blended with neighboring emission lines. We identify five temporal windows with distinct emission line response, and measure their corresponding time delays, which range from 2 to 13 days. These temporal windows are plausibly linked to changes in the UV and X-ray obscuration occurring during these same intervals. The shortest time lags occur during periods with diminishing obscuration, whereas the longest lags occur during periods with rising obscuration. We propose that the obscuring outflow shields the ultraviolet broad lines from the ionizing continuum. The resulting change in the spectral energy distribution of the ionizing continuum, as seen by clouds at a range of distances from the nucleus, is responsible for the changes in the line response.
AI Key Findings
Generated Sep 02, 2025
Methodology
The research utilized intensive reverberation mapping with the Hubble Space Telescope's Cosmic Origins Spectrograph (COS) on Mrk 817, observing significant variations in the response of broad UV emission lines to continuum fluctuations over a 14-month period.
Key Results
- Distinct temporal windows with different emission line response were identified, each with varying time delays ranging from 2 to 13 days.
- Shortest time lags occurred during periods with diminishing obscuration, while longest lags occurred during periods with rising obscuration.
- The CIV line, least affected by intrinsic absorption, showed the most evident variations, suggesting changes in UV and X-ray obscuration.
Significance
This study provides insights into the complex behavior of Active Galactic Nuclei (AGN), revealing how changes in the spectral energy distribution of the ionizing continuum, due to varying obscuration, affect the response of the broad-line region.
Technical Contribution
The paper presents a detailed analysis of AGN variability using advanced spectral modeling techniques, incorporating a reddened power-law continuum and multiple Gaussian components to fit emission and broad absorption features.
Novelty
This research distinguishes itself by revealing complexities in broad-line region structure and response to continuum fluctuations in Mrk 817, going beyond the simplest concepts initially envisioned for reverberation mapping experiments.
Limitations
- The research was limited by the presence of gaps in observations and complex light curve behavior, which made it challenging to implement a weighted approach for reconstructing the continuum flux.
- The analysis could not definitively verify the two isolated archival spectrum measurements due to the lack of contemporaneous continuum monitoring and time-delay correction.
Future Work
- Future work will extend the analysis to Lyα, NV, SiIV, and HeII.
- The team plans to model the effects of absorption on emission-line profiles and deblend adjacent emission lines for a more accurate analysis.
Paper Details
PDF Preview
Key Terms
Citation Network
Current paper (gray), citations (green), references (blue)
Display is limited for performance on very large graphs.
Similar Papers
Found 4 papersAGN STORM 2. IV. Swift X-ray and ultraviolet/optical monitoring of Mrk 817
Chen Hu, Alexei V. Filippenko, Catherine J. Grier et al.
AGN STORM 2: X. The origin of the interband continuum delays in Mrk 817
Chen Hu, Yasaman Homayouni, Keith Horne et al.
AGN STORM 2. III. A NICER view of the variable X-ray obscurer in Mrk 817
Chen Hu, Alexei V. Filippenko, Catherine J. Grier et al.
No citations found for this paper.
Comments (0)