Summary
Despite a wealth of multi-wavelength, spatially resolved, time-domain solar activity data, an accurate and complete temporo-spatial solar flare census is unavailable, which impedes our understanding of the physics of flare production. We present an Automatically Labeled EUV and X-ray Incident SolarFlares (ALEXIS) pipeline, designed to decompose the X-Ray flux of the full solar disk into a minimum set of discrete regions on the Solar surface. ALEXIS returns an average RMSE between the XRS time series and the discrete EUV signals of 0.066 $\pm$ 0.036 for a randomly selected test bed sample of 1000 hour-long data segments from May 2010 - March 2020. Flare emission that requires multiple regions was found to be synchronous: flares occurring at the same time, sympathetic: flares separated by minutes, or needed to capture the background emission before and/or after the main flare. ALEXIS uses the original full resolution and cadence of both the Atmospheric Imaging Assembly Instrument and the GOES13-15 Solar X-Ray Imager. Comparison of the ALEXIS catalog with those produced by SWPC and SolarSoft show that these canonical databases need revisiting for 62$\%$ and 15$\%$ of the sub-sample, respectively. Additionally, we increased the number of flares reported by SWPC and SolarSoft by 15$\%$. Our pipeline misses 6.7$\%$ of the 1057 flare sub-sample and returns 5$\%$ of false positives from 1211 flares reported by ALEXIS. The ALEXIS catalog returns flare peak times, coordinates, the corrected scaled XRay magnitude, and the associated NOAA active region with a HARP identifier number independently from any external data products.
AI Key Findings
Generated Jun 09, 2025
Methodology
ALEXIS is a pipeline that uses computer vision techniques and clustering algorithms to accurately pinpoint solar flares by identifying discreet regions on the Sun that are continuously bright temporally and hyperspectrally. It uses the highest cadence and full-resolution data from SDO's AIA and GOES13-15's SXI telescopes.
Key Results
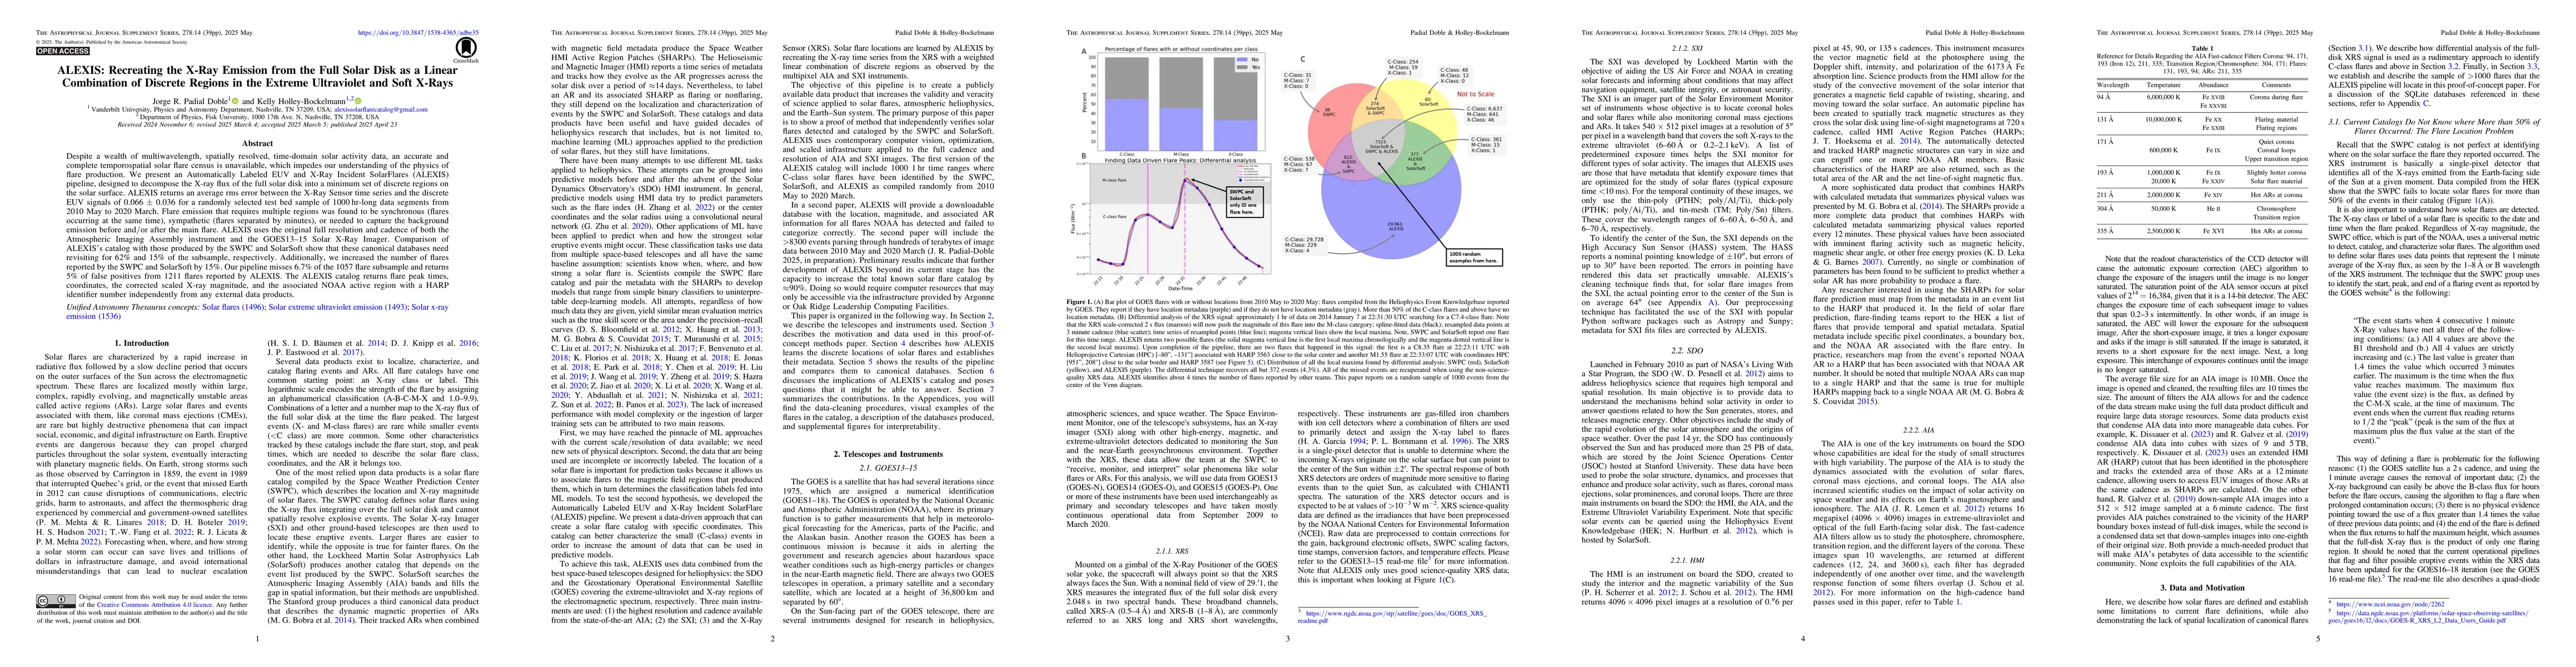
- ALEXIS identified 1211 solar flares, with 5% being false positives.
- ALEXIS found 159 new flares not previously cataloged, a 15% increase over canonical catalogs.
- The pipeline misses 7% of the 1057 flare sub-sample it was set out to find.
Significance
This research provides a data-driven pipeline capable of identifying the location and magnitude of solar flares independently of previous data products, enabling detailed solar flare studies.
Technical Contribution
ALEXIS uses LASSO regression to minimize the difference between XRS signals and linear combinations of EUV or X-ray discreet regions, accurately recreating the solar disk's X-ray emission.
Novelty
ALEXIS stands out by automatically downloading solar images across multiple wavelengths and cadences, identifying potential flaring locations using peak-finding and density-based clustering, and generating time series for each wavelength available.
Limitations
- ALEXIS struggles with HARP and NOAA AR associations on the solar limb due to overlapping boundaries.
- The pipeline fails to find flares where the peak of X-ray and EUV/soft X-ray emission differ by more than 2 minutes.
Future Work
- Improve handling of HARP and NOAA AR associations on the solar limb.
- Refine flare start and stop time identification using higher-order differential analysis.
Paper Details
PDF Preview
Citation Network
Current paper (gray), citations (green), references (blue)
Display is limited for performance on very large graphs.
Similar Papers
Found 4 papersNo citations found for this paper.
Comments (0)