Publication
Metrics
AI Quick Summary
This paper introduces DAGmaps, a space-filling visualization method for phylogenetic networks, focusing on galled trees and networks. It presents linear time algorithms to effectively visualize these structures using minimal space.
Paper Preview
Abstract
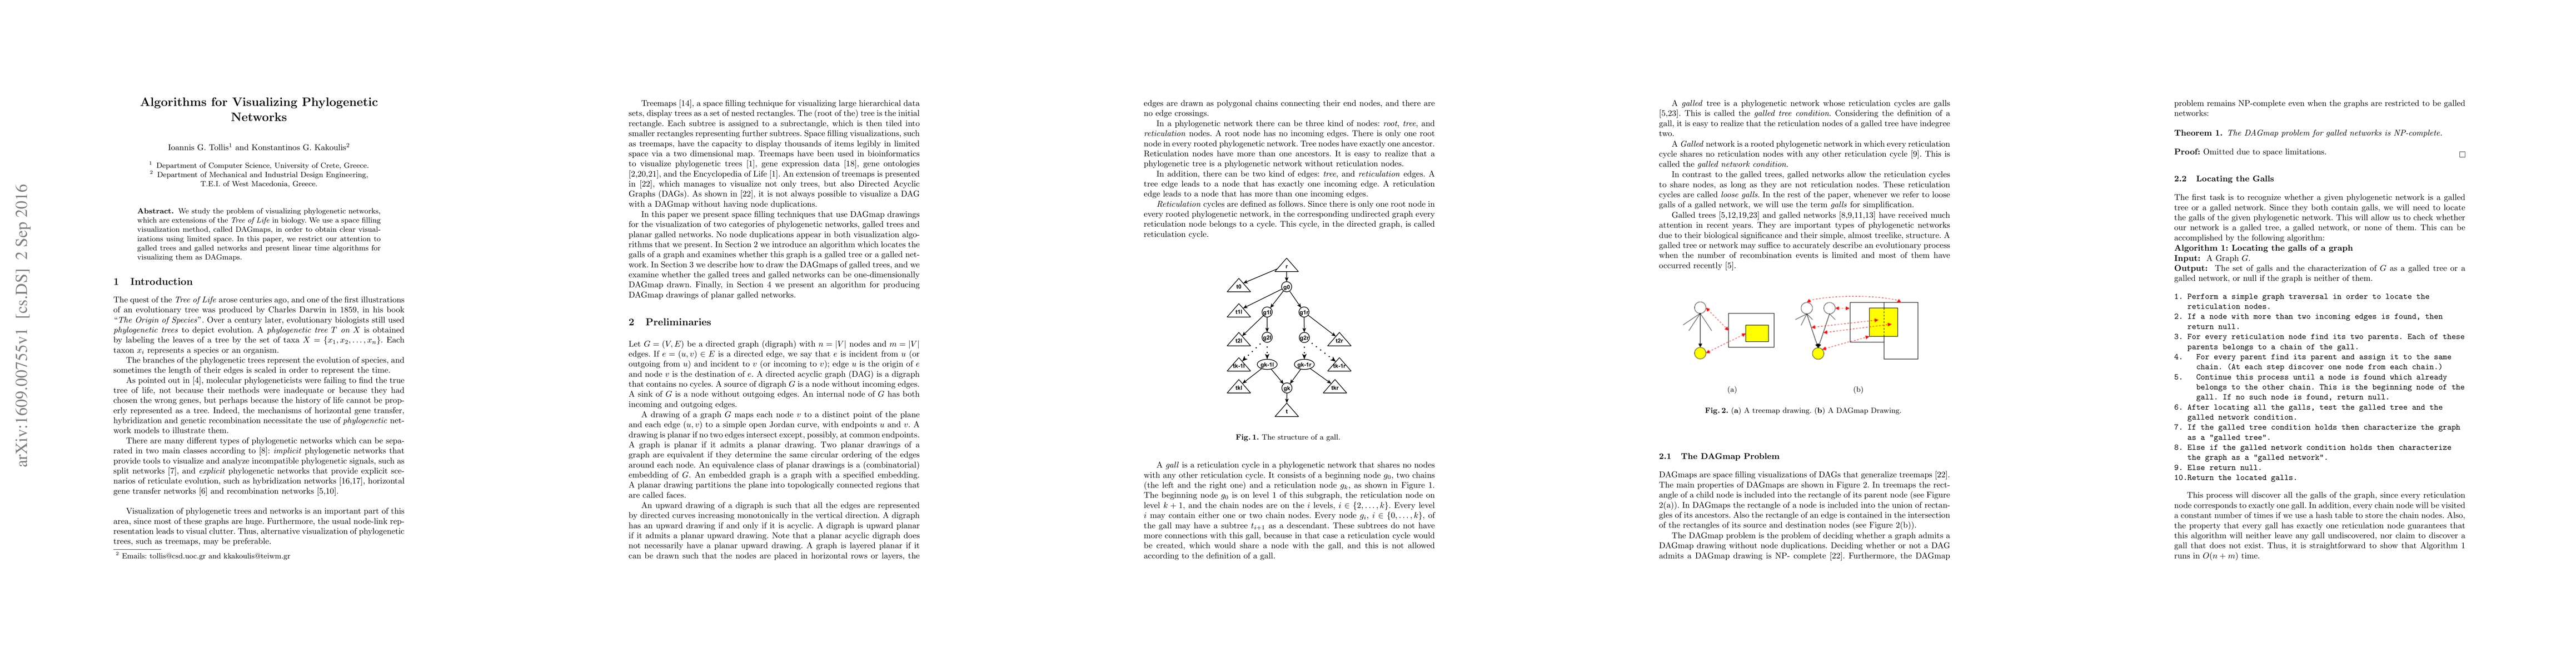
We study the problem of visualizing phylogenetic networks, which are extensions of the Tree of Life in biology. We use a space filling visualization method, called DAGmaps, in order to obtain clear visualizations using limited space. In this paper, we restrict our attention to galled trees and galled networks and present linear time algorithms for visualizing them as DAGmaps.
AI Key Findings
Get AI-generated insights about this paper's methodology, results, significance, and more — seven facets brought into focus.
Impact
Paper Details
PDF Preview
Key Terms
Citation Network
Current paper (gray), citations (green), references (blue)
Display is limited for performance on very large graphs.
Discussion 0