AMADA-Analysis of Multidimensional Astronomical Datasets
Publication
Metrics
AI Quick Summary
AMADA is a web application for analyzing multidimensional astronomical datasets. It offers interactive tools like hierarchical clustering, various correlation analyses, and principal components analysis, visualized through heatmaps, dendrograms, chord diagrams, and polar bar plots. The R-based application is open-source and accessible at provided links.
Paper Preview
Abstract
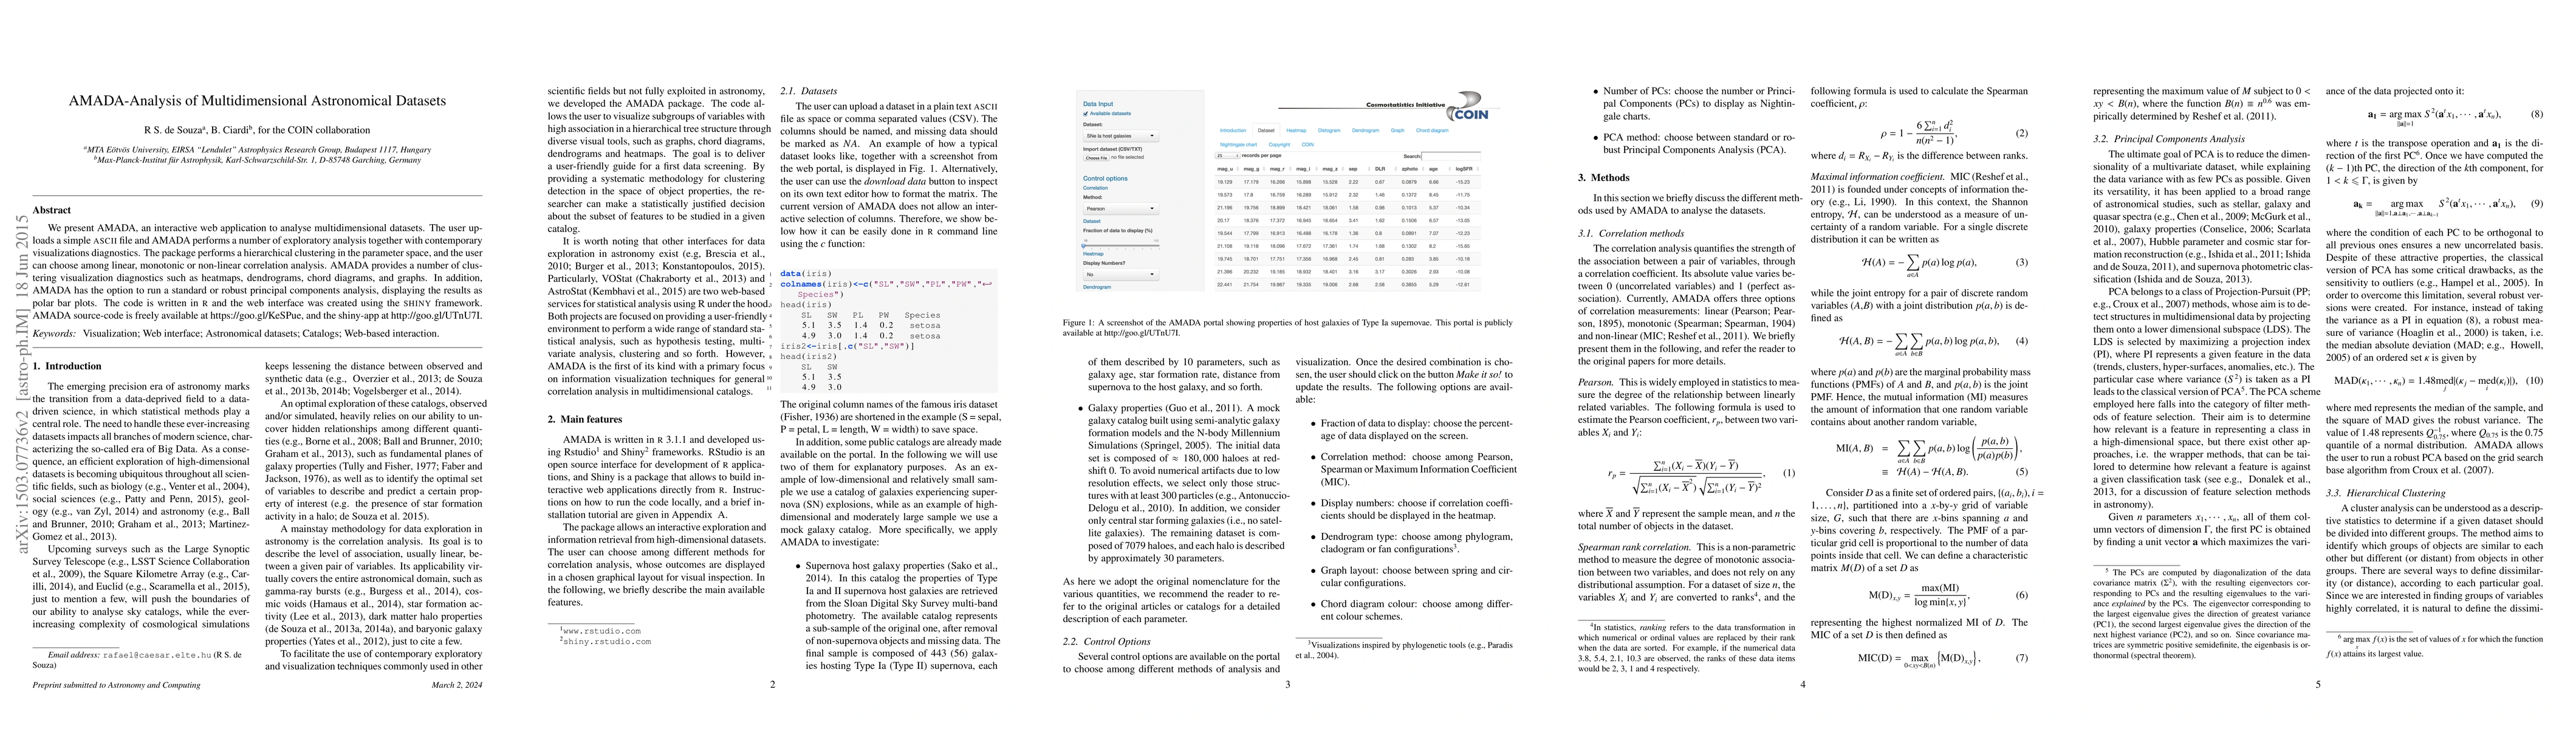
We present AMADA, an interactive web application to analyse multidimensional datasets. The user uploads a simple ASCII file and AMADA performs a number of exploratory analysis together with contemporary visualizations diagnostics. The package performs a hierarchical clustering in the parameter space, and the user can choose among linear, monotonic or non-linear correlation analysis. AMADA provides a number of clustering visualization diagnostics such as heatmaps, dendrograms, chord diagrams, and graphs. In addition, AMADA has the option to run a standard or robust principal components analysis, displaying the results as polar bar plots. The code is written in R and the web interface was created using the Shiny framework. AMADA source-code is freely available at https://goo.gl/KeSPue, and the shiny-app at http://goo.gl/UTnU7I.
AI Key Findings
Get AI-generated insights about this paper's methodology, results, significance, and more — seven facets brought into focus.
Impact
Paper Details
PDF Preview
Key Terms
Citation Network
Current paper (gray), citations (green), references (blue)
Display is limited for performance on very large graphs.
Discussion 0