Summary
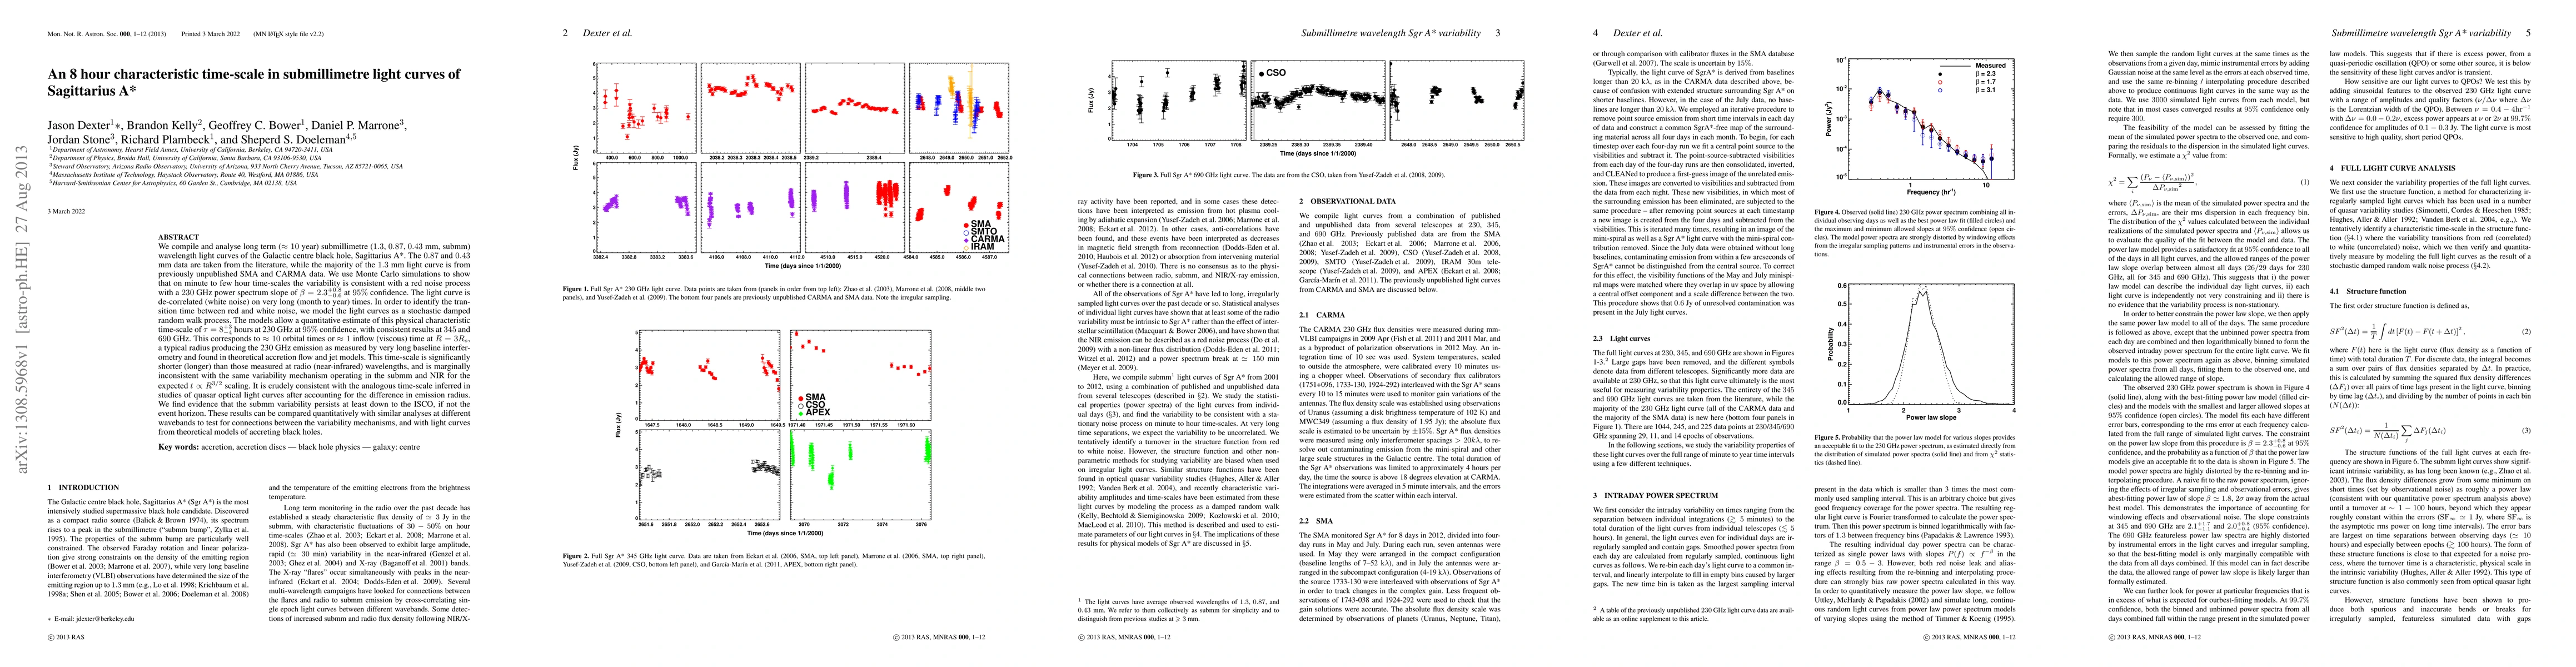
We compile and analyse long term (~10 year) submillimetre (1.3, 0.87, 0.43 mm, submm) wavelength light curves of the Galactic centre black hole, Sagittarius A*. The 0.87 and 0.43 mm data are taken from the literature, while the majority of the 1.3 mm light curve is from previously unpublished SMA and CARMA data. We use Monte Carlo simulations to show that on minute to few hour time-scales the variability is consistent with a red noise process with a 230 GHz power spectrum slope of 2.3+0.8-0.6 at 95% confidence. The light curve is de-correlated (white noise) on very long (month to year) times. In order to identify the transition time between red and white noise, we model the light curves as a stochastic damped random walk process. The models allow a quantitative estimate of this physical characteristic time-scale of 8-4+3 hours at 230 GHz at 95% confidence, with consistent results at 345 and 690 GHz. This corresponds to ~10 orbital times or ~1 inflow (viscous) time at R = 3 Rs, a typical radius producing the 230 GHz emission as measured by very long baseline interferometry and found in theoretical accretion flow and jet models. This time-scale is significantly shorter (longer) than those measured at radio (near-infrared, NIR) wavelengths, and is marginally inconsistent with the same variability mechanism operating in the submm and NIR for the expected t ~ R^3/2 scaling. It is crudely consistent with the analogous time-scale inferred in studies of quasar optical light curves after accounting for the difference in emission radius. We find evidence that the submm variability persists at least down to the ISCO, if not the event horizon. These results can be compared quantitatively with similar analyses at different wavebands to test for connections between the variability mechanisms, and with light curves from theoretical models of accreting black holes.
AI Key Findings
Get AI-generated insights about this paper's methodology, results, and significance.
Paper Details
PDF Preview
Key Terms
Citation Network
Current paper (gray), citations (green), references (blue)
Display is limited for performance on very large graphs.
Similar Papers
Found 4 papersDynamical Inference from Polarized Light Curves of Sagittarius A*
Angelo Ricarte, Razieh Emami, Chi-kwan Chan et al.
Millimeter light curves of Sagittarius A* observed during the 2017 Event Horizon Telescope campaign
Garrett K. Keating, Michael D. Johnson, Venkatessh Ramakrishnan et al.
| Title | Authors | Year | Actions |
|---|
Comments (0)