An Analysis of COVID-19 Knowledge Graph Construction and Applications
Publication
Metrics
AI Quick Summary
A knowledge graph was constructed from COVID-19 tweets in Los Angeles, combining with policy announcements and disease statistics to analyze public sentiments and their correlation with real-world events.
Paper Preview
Abstract
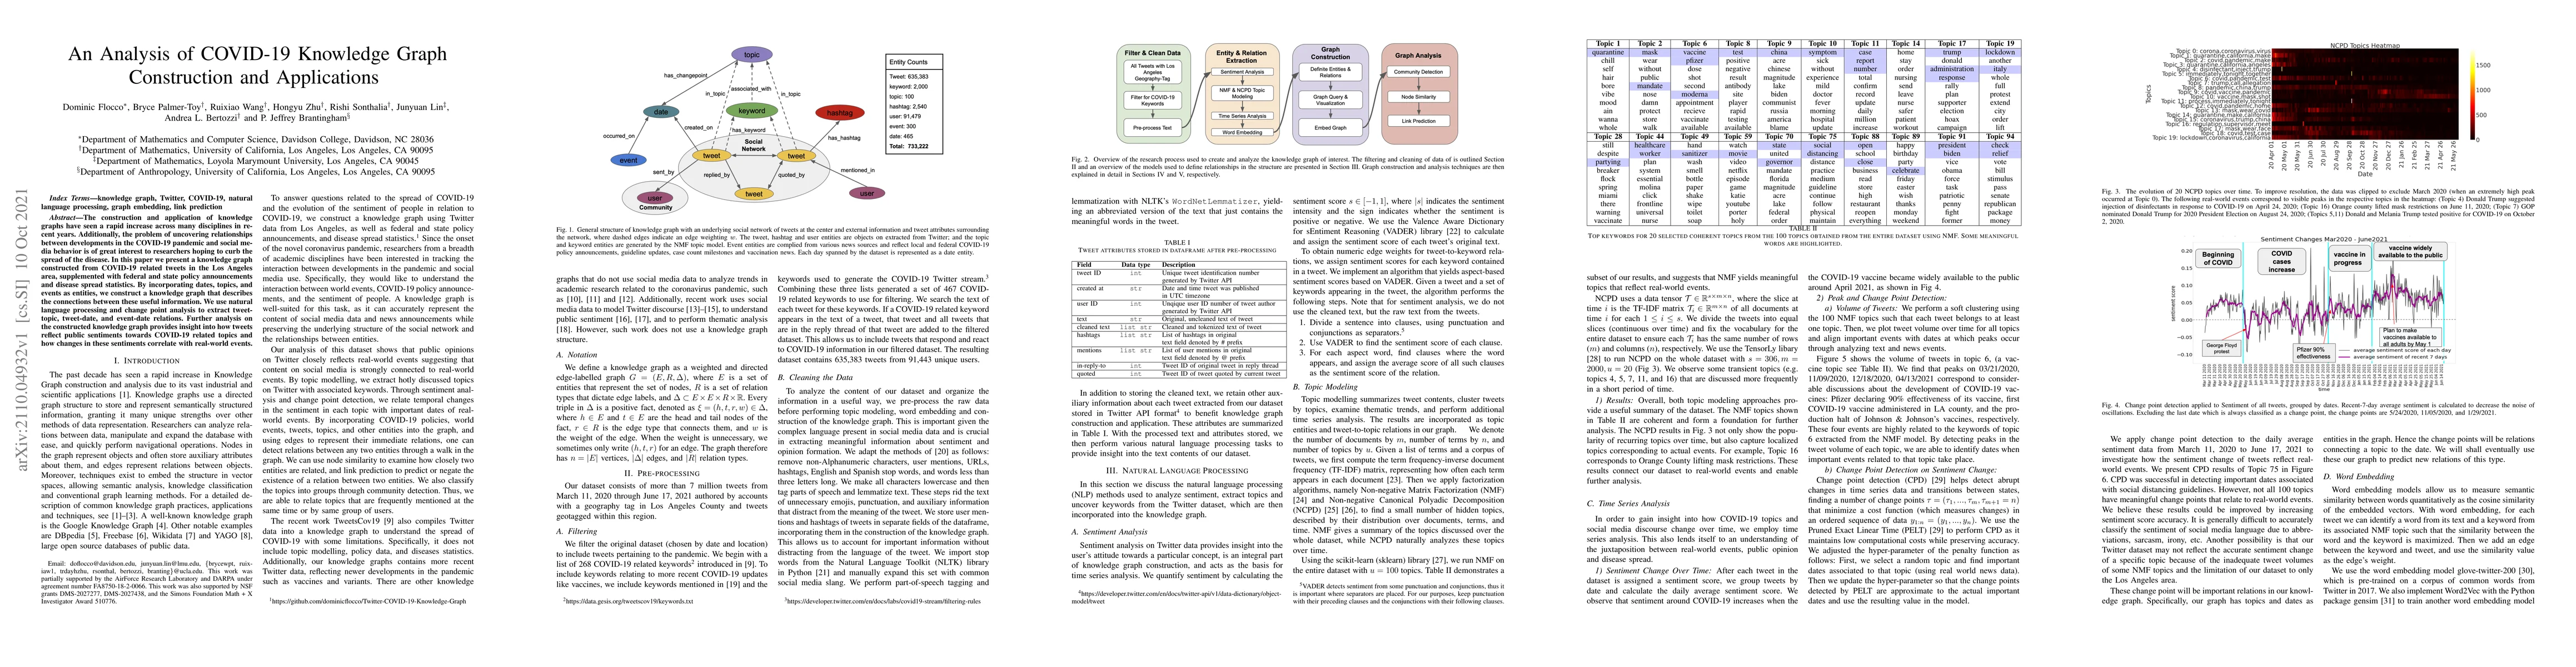
The construction and application of knowledge graphs have seen a rapid increase across many disciplines in recent years. Additionally, the problem of uncovering relationships between developments in the COVID-19 pandemic and social media behavior is of great interest to researchers hoping to curb the spread of the disease. In this paper we present a knowledge graph constructed from COVID-19 related tweets in the Los Angeles area, supplemented with federal and state policy announcements and disease spread statistics. By incorporating dates, topics, and events as entities, we construct a knowledge graph that describes the connections between these useful information. We use natural language processing and change point analysis to extract tweet-topic, tweet-date, and event-date relations. Further analysis on the constructed knowledge graph provides insight into how tweets reflect public sentiments towards COVID-19 related topics and how changes in these sentiments correlate with real-world events.
AI Key Findings
Get AI-generated insights about this paper's methodology, results, significance, and more — seven facets brought into focus.
Impact
Paper Details
Authors
PDF Preview
Key Terms
Citation Network
Current paper (gray), citations (green), references (blue)
Display is limited for performance on very large graphs.
Discussion 0