Publication
Metrics
AI Quick Summary
This paper provides a formal framework for data visualization using t-SNE, offering rigorous analysis and the first provable guarantees on t-SNE's performance under deterministic conditions on the underlying data clusters. It also demonstrates t-SNE's effectiveness in recovering cluster structure even when these conditions are not fully met.
Paper Preview
Abstract
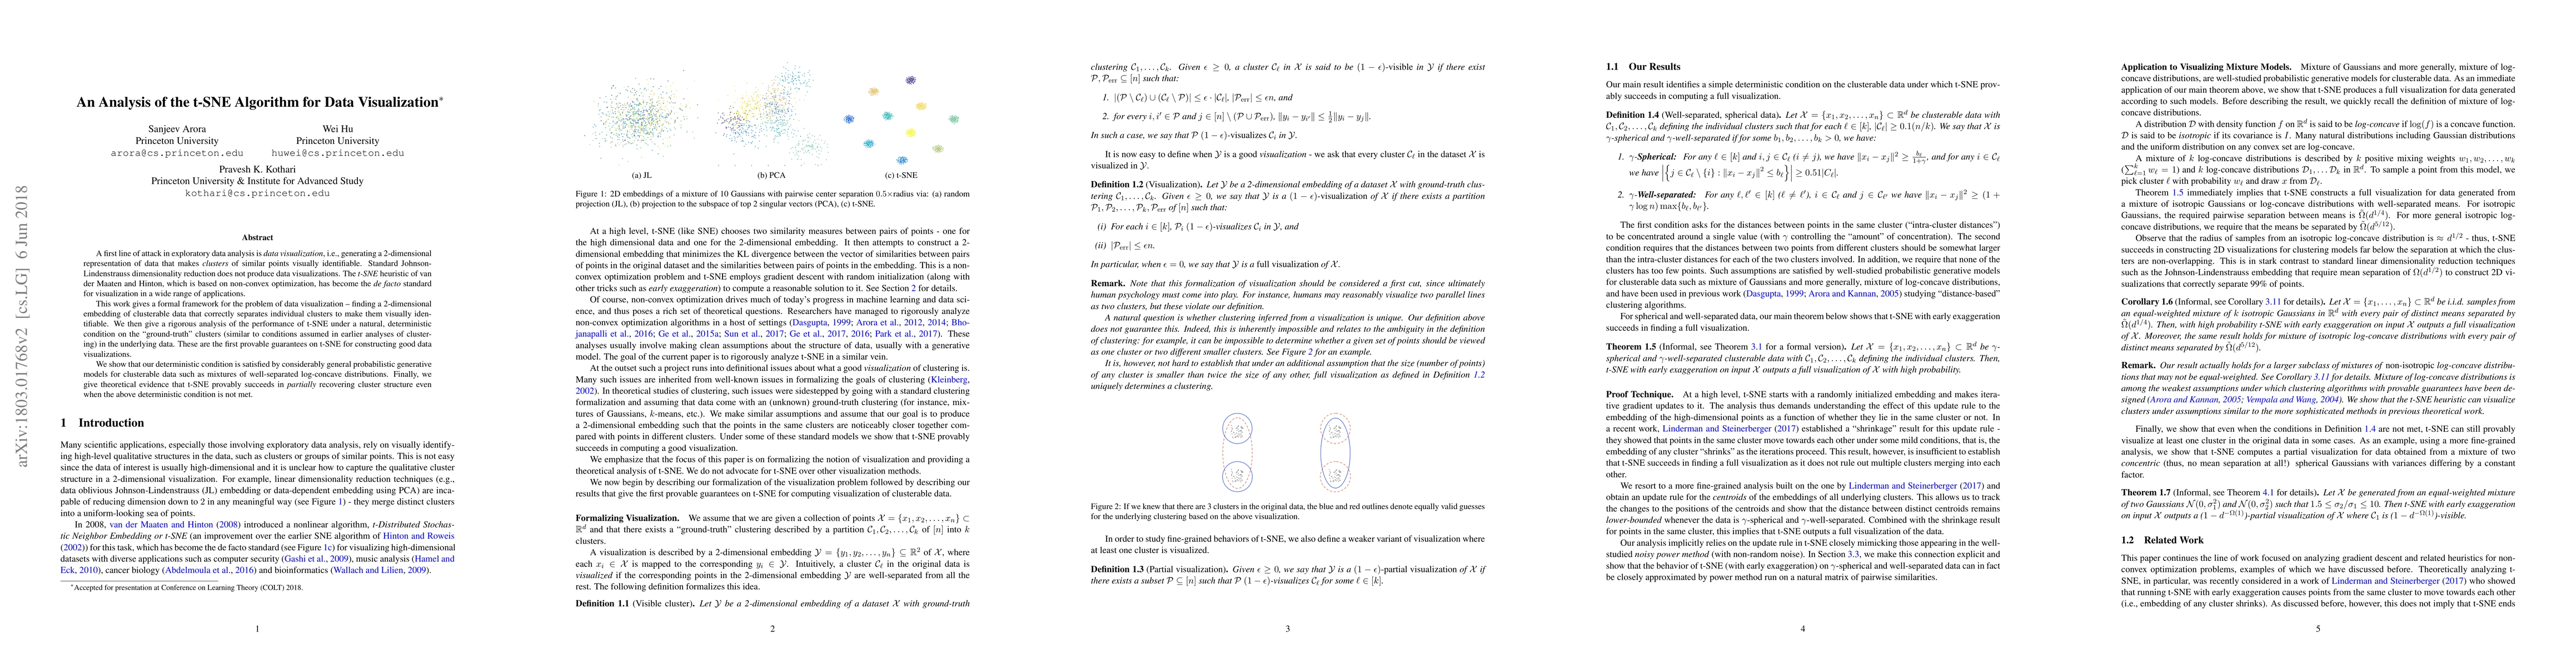
A first line of attack in exploratory data analysis is data visualization, i.e., generating a 2-dimensional representation of data that makes clusters of similar points visually identifiable. Standard Johnson-Lindenstrauss dimensionality reduction does not produce data visualizations. The t-SNE heuristic of van der Maaten and Hinton, which is based on non-convex optimization, has become the de facto standard for visualization in a wide range of applications. This work gives a formal framework for the problem of data visualization - finding a 2-dimensional embedding of clusterable data that correctly separates individual clusters to make them visually identifiable. We then give a rigorous analysis of the performance of t-SNE under a natural, deterministic condition on the "ground-truth" clusters (similar to conditions assumed in earlier analyses of clustering) in the underlying data. These are the first provable guarantees on t-SNE for constructing good data visualizations. We show that our deterministic condition is satisfied by considerably general probabilistic generative models for clusterable data such as mixtures of well-separated log-concave distributions. Finally, we give theoretical evidence that t-SNE provably succeeds in partially recovering cluster structure even when the above deterministic condition is not met.
AI Key Findings
Get AI-generated insights about this paper's methodology, results, significance, and more — seven facets brought into focus.
Impact
Paper Details
PDF Preview
Key Terms
Citation Network
Current paper (gray), citations (green), references (blue)
Display is limited for performance on very large graphs.
Discussion 0