An asymptotically normal test for the selective neutrality hypothesis
Publication
Metrics
AI Quick Summary
The test uses a single statistic based on the mean number of pairwise nucleotide differences and is more straightforward than previous tests with complex empirical behavior.
Paper Preview
Abstract
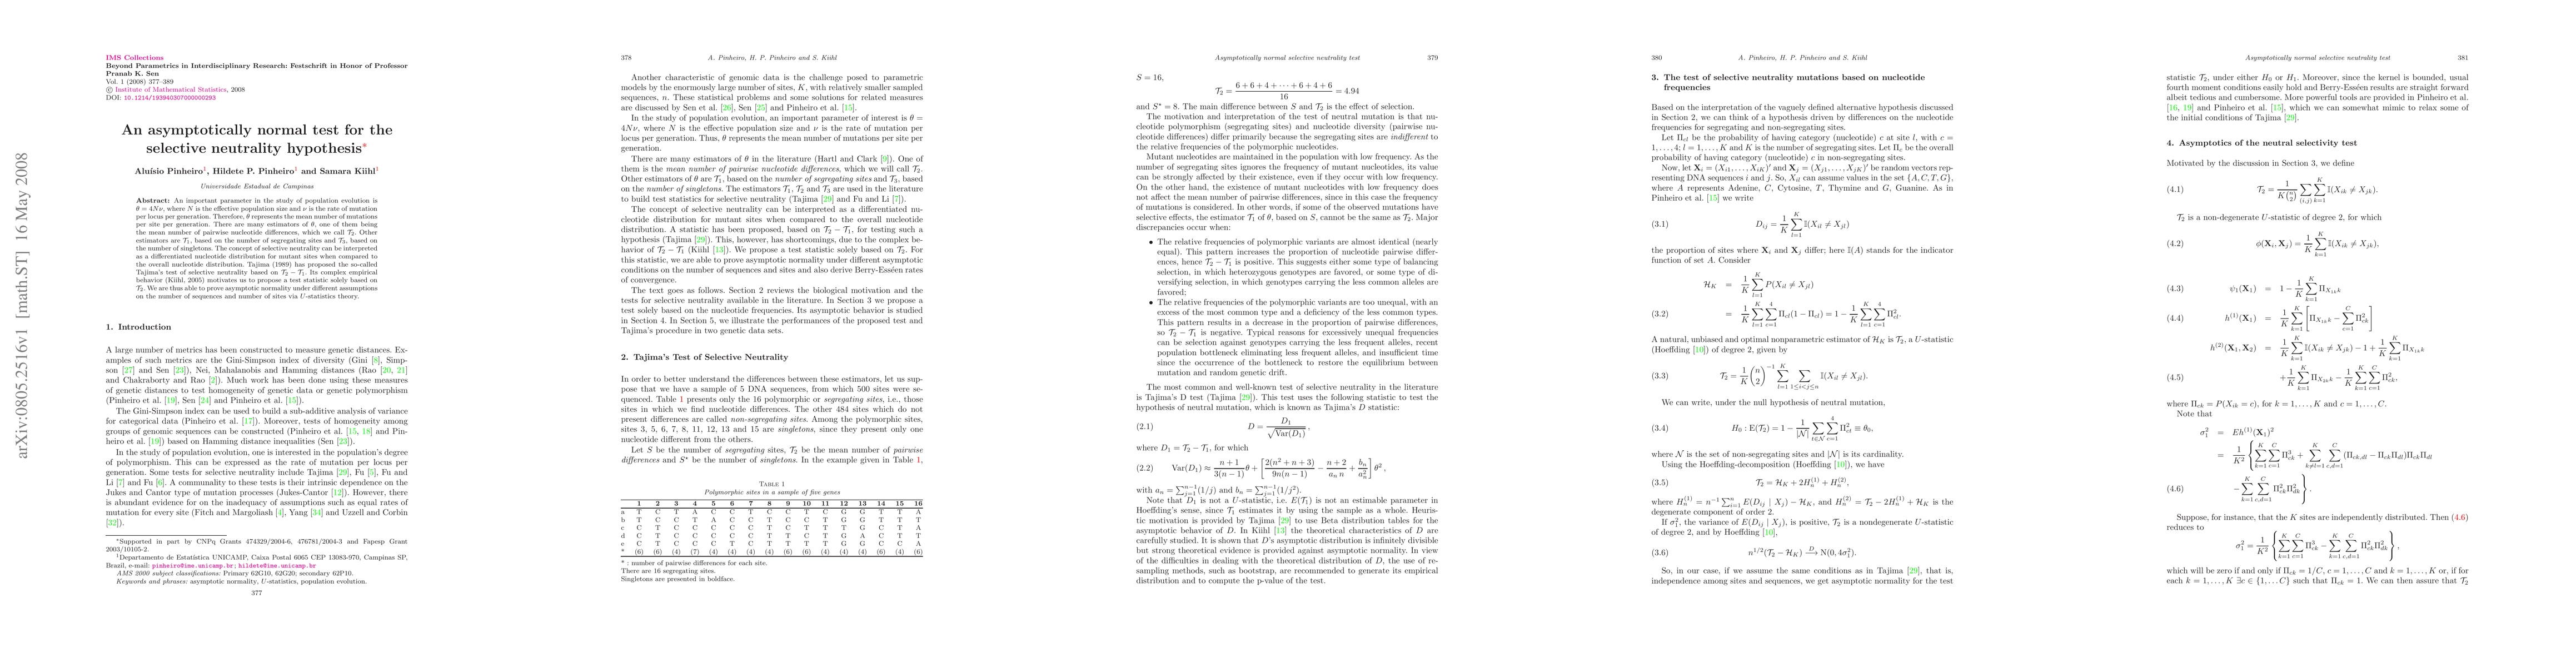
An important parameter in the study of population evolution is $\theta=4N\nu$, where $N$ is the effective population size and $\nu$ is the rate of mutation per locus per generation. Therefore, $\theta$ represents the mean number of mutations per site per generation. There are many estimators of $\theta$, one of them being the mean number of pairwise nucleotide differences, which we call $\mathcal{T}_2$. Other estimators are $\mathcal{T}_1$, based on the number of segregating sites and $\mathcal{T}_3$, based on the number of singletons. The concept of selective neutrality can be interpreted as a differentiated nucleotide distribution for mutant sites when compared to the overall nucleotide distribution. Tajima (1989) has proposed the so-called Tajima's test of selective neutrality based on $\mathcal{T}_2-\mathcal{T}_1$. Its complex empirical behavior (Kiihl, 2005) motivates us to propose a test statistic solely based on $\mathcal{T}_2$. We are thus able to prove asymptotic normality under different assumptions on the number of sequences and number of sites via $U$-statistics theory.
AI Key Findings
Get AI-generated insights about this paper's methodology, results, significance, and more — seven facets brought into focus.
Impact
Paper Details
PDF Preview
Key Terms
Citation Network
Current paper (gray), citations (green), references (blue)
Display is limited for performance on very large graphs.
Discussion 0