Summary
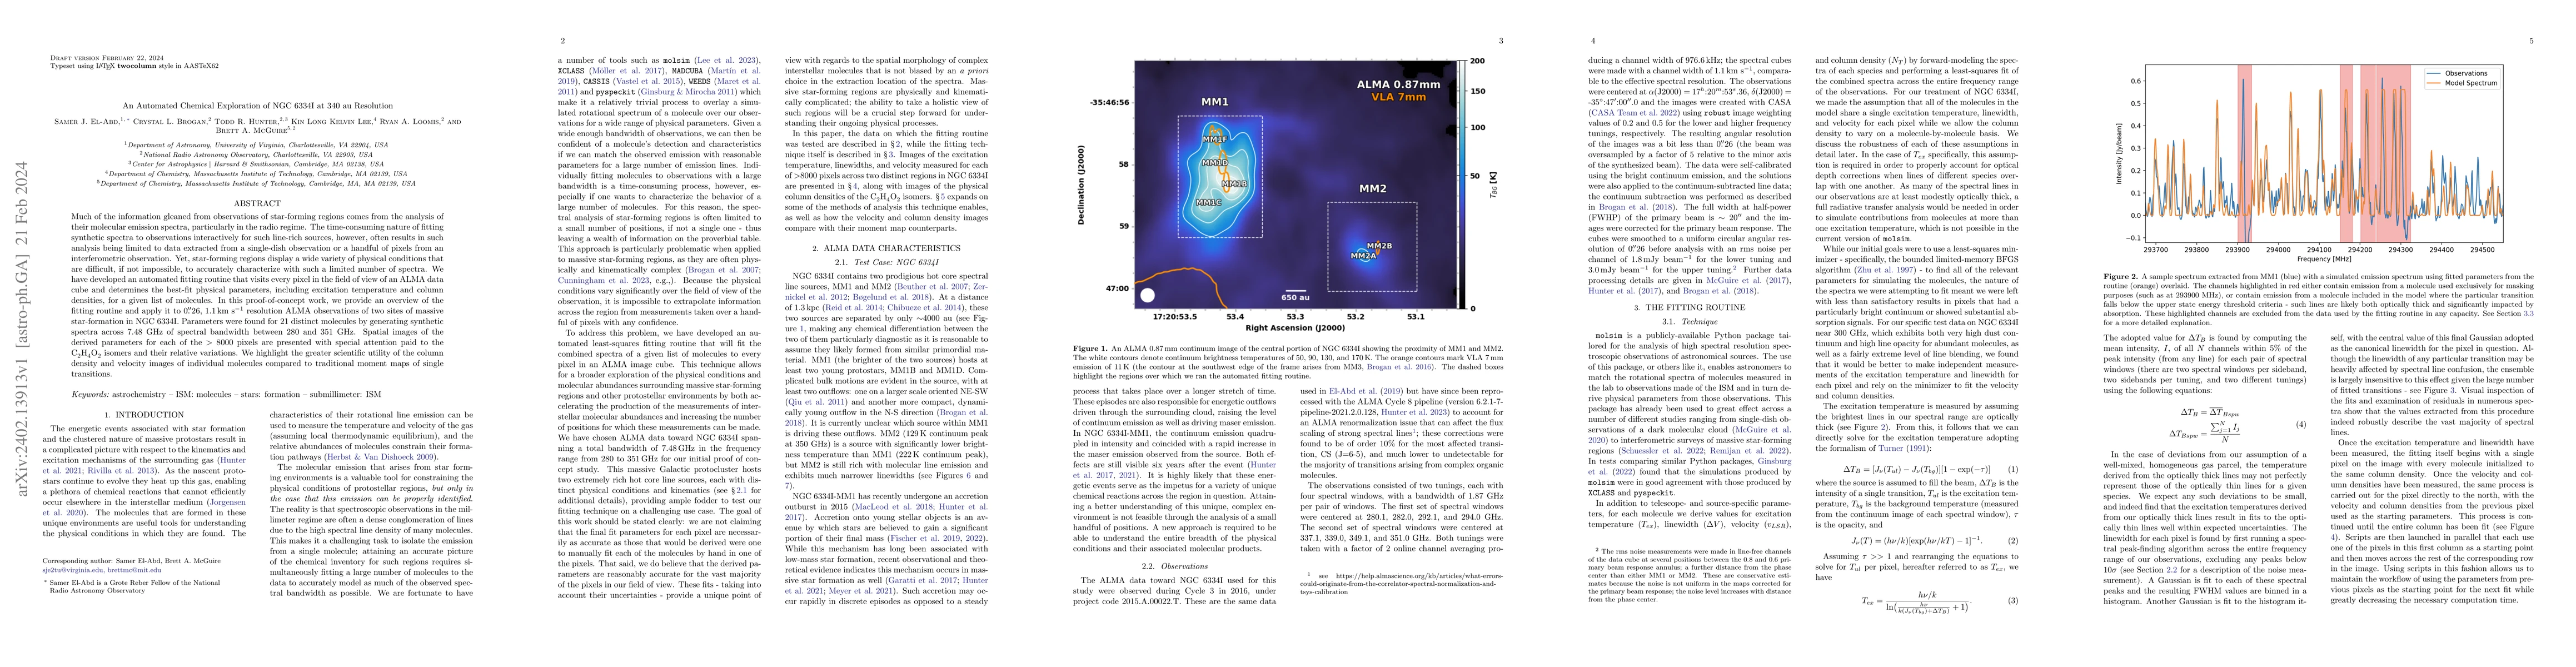
Much of the information gleaned from observations of star-forming regions comes from the analysis of their molecular emission spectra, particularly in the radio regime. The time-consuming nature of fitting synthetic spectra to observations interactively for such line-rich sources, however, often results in such analysis being limited to data extracted from a single-dish observation or a handful of pixels from an interferometric observation. Yet, star-forming regions display a wide variety of physical conditions that are difficult, if not impossible, to accurately characterize with such a limited number of spectra. We have developed an automated fitting routine that visits every pixel in the field of view of an ALMA data cube and determines the best-fit physical parameters, including excitation temperature and column densities, for a given list of molecules. In this proof-of-concept work, we provide an overview of the fitting routine and apply it to 0".26, 1.1 km s$^{-1}$ resolution ALMA observations of two sites of massive star-formation in NGC 6334I. Parameters were found for 21 distinct molecules by generating synthetic spectra across 7.48 GHz of spectral bandwidth between 280 and 351 GHz. Spatial images of the derived parameters for each of the > 8000 pixels are presented with special attention paid to the C$_2$H$_4$O$_2$ isomers and their relative variations. We highlight the greater scientific utility of the column density and velocity images of individual molecules compared to traditional moment maps of single transitions.
AI Key Findings
Get AI-generated insights about this paper's methodology, results, and significance.
Paper Details
PDF Preview
Key Terms
Citation Network
Current paper (gray), citations (green), references (blue)
Display is limited for performance on very large graphs.
| Title | Authors | Year | Actions |
|---|
Comments (0)