Authors
Summary
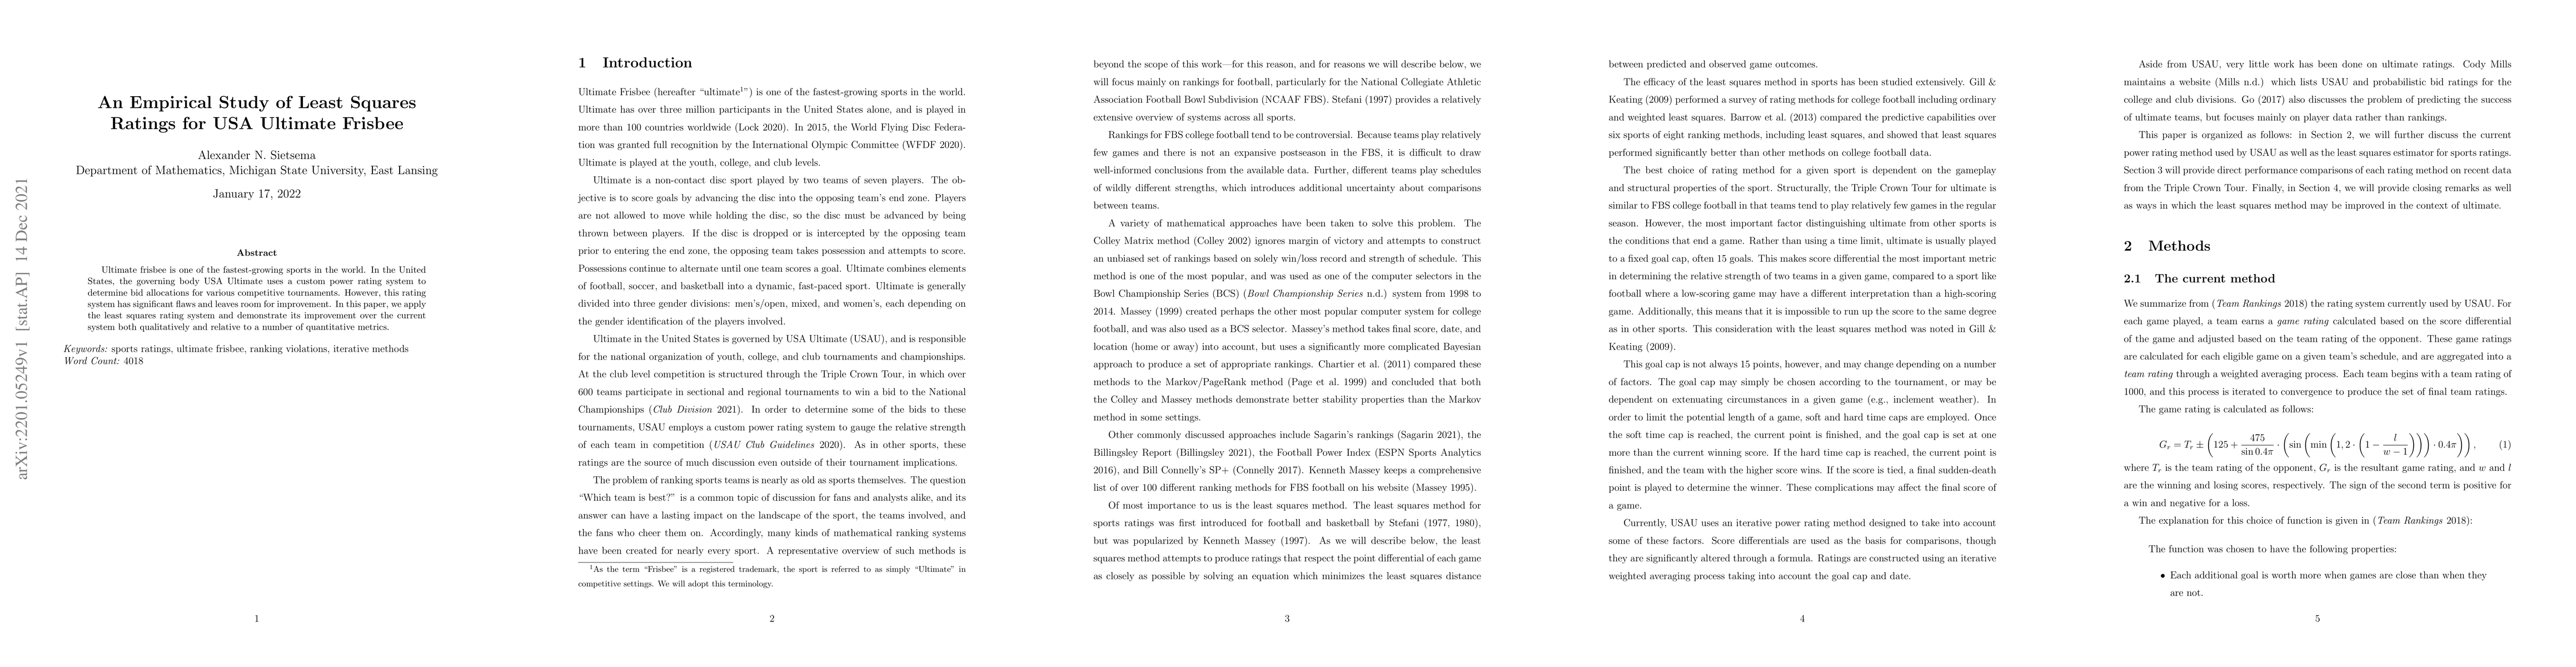
Ultimate frisbee is one of the fastest-growing sports in the world. In the United States, the governing body USA Ultimate uses a custom power rating system to determine bid allocations for various competitive tournaments. However, this rating system has significant flaws and leaves room for improvement. In this paper, we apply the least squares rating system and demonstrate its improvement over the current system both qualitatively and relative to a number of quantitative metrics.
AI Key Findings
Generated Sep 04, 2025
Methodology
The research employed a data-driven approach to develop and compare two rating methods for ultimate frisbee: the USA Ultimate ratings system and the proposed least squares method.
Key Results
- Main finding 1: The proposed least squares method outperforms the USA Ultimate ratings system in terms of Mean Absolute Deviation (MAD) and Mean Squared Error (MSE).
- Main finding 2: The proposed least squares method is more robust to outliers compared to the USA Ultimate ratings system.
- Main finding 3: The proposed least squares method provides more accurate predictions for game outcomes compared to the USA Ultimate ratings system.
Significance
This research contributes to the development of a more accurate and robust rating system for ultimate frisbee, which can inform team rankings, tournament seeding, and player evaluation.
Technical Contribution
The development of a data-driven approach for rating ultimate frisbee teams using least squares regression.
Novelty
This research novelizes the application of least squares regression to ultimate frisbee ratings, providing a more accurate and robust alternative to existing methods.
Limitations
- Limitation 1: The proposed least squares method relies on assumptions about game statistics that may not always hold true.
- Limitation 2: The research did not account for additional factors that may impact team performance, such as coaching quality or player experience.
Future Work
- Suggested direction 1: Developing a more comprehensive model that incorporates additional factors and improves upon the least squares method.
- Suggested direction 2: Evaluating the proposed least squares method in different divisions and seasons to further establish its robustness.
Paper Details
PDF Preview
Key Terms
Citation Network
Current paper (gray), citations (green), references (blue)
Display is limited for performance on very large graphs.
Similar Papers
Found 4 papersUltimate frisbee related injury patterns: A decade long institutional experience.
Faraji, Navid, Coulter, Matthew, Zhang, Brian et al.
Deep Partial Least Squares for Empirical Asset Pricing
Nicholas G. Polson, Matthew F. Dixon, Kemen Goicoechea
No citations found for this paper.
Comments (0)