An Empirical Study on the Relationship Between the Number of Coordinated Views and Visual Analysis
Publication
Metrics
AI Quick Summary
This study investigates how the number of coordinated multiple views (CMVs) affects visual analysis processes and results. Through a between-subject study with 44 participants, the researchers found a positive correlation between the number of CMVs and analytical outcomes, suggesting that more views can enhance analysis. The study also highlights the benefits of visualization duplication in encouraging diverse analytical strategies.
Paper Preview
Abstract
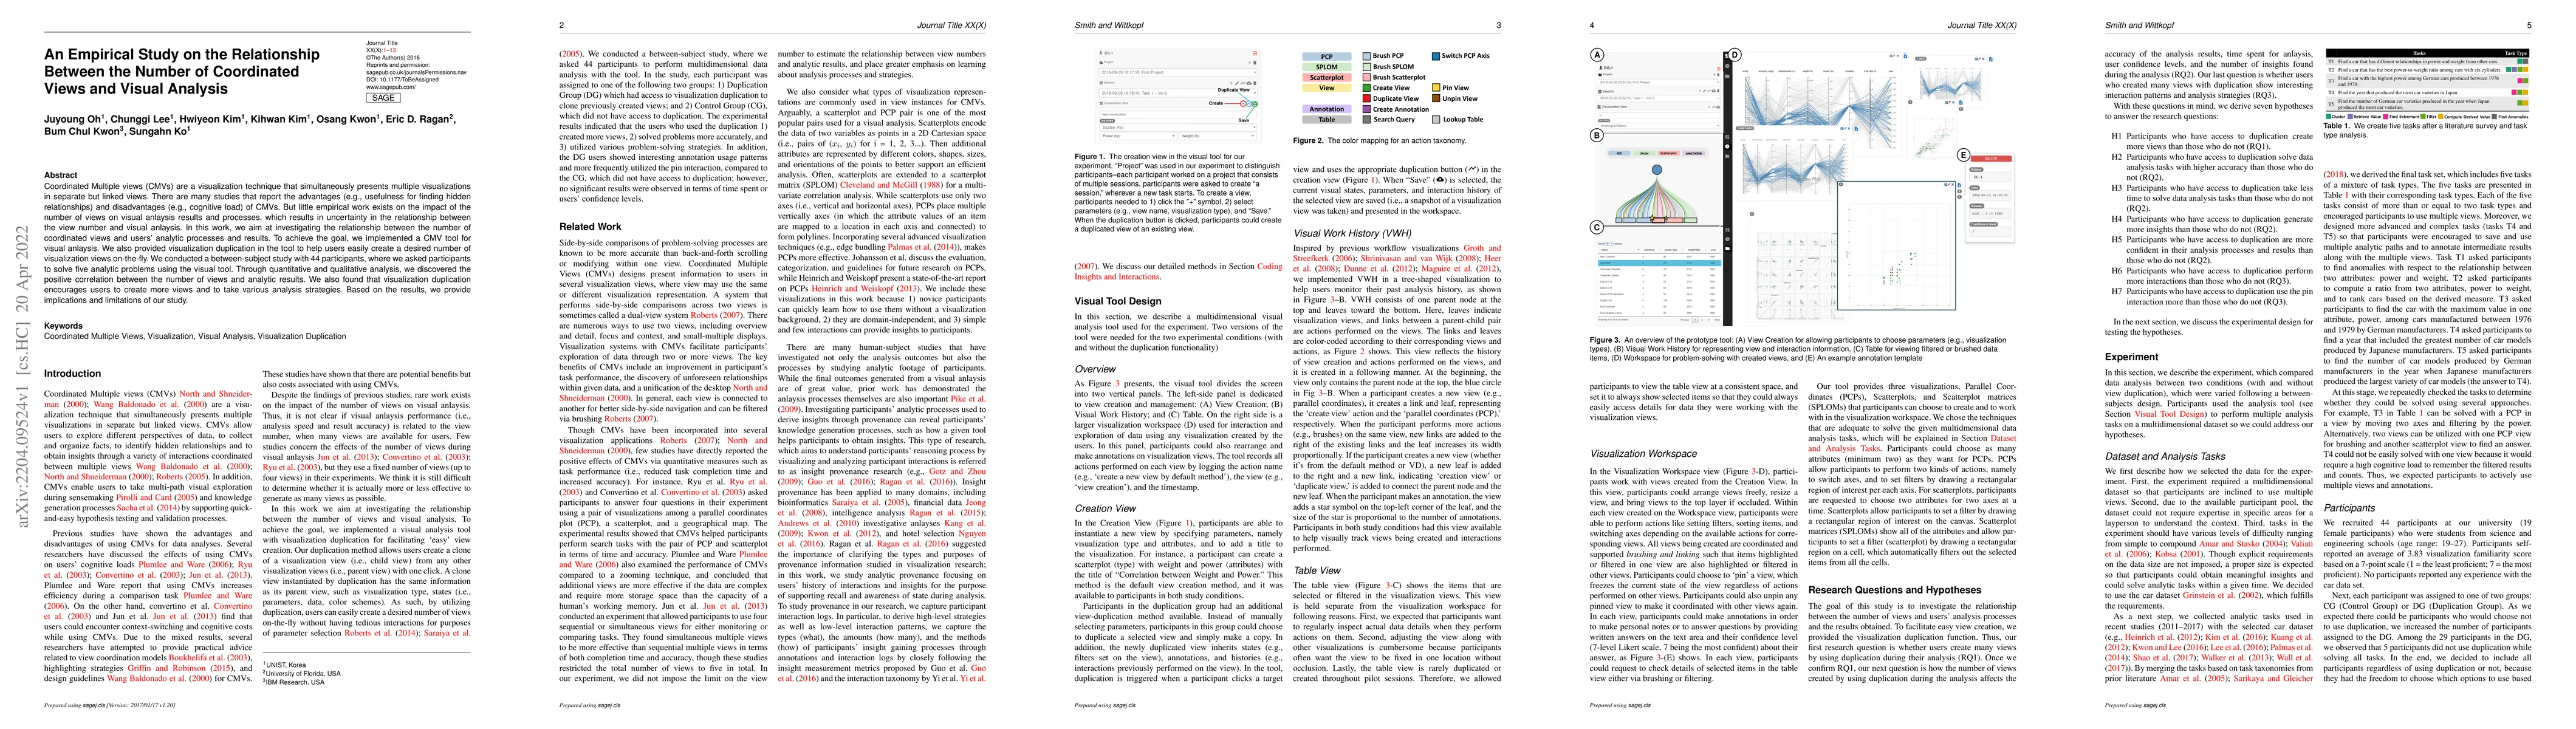
Coordinated Multiple views (CMVs) are a visualization technique that simultaneously presents multiple visualizations in separate but linked views. There are many studies that report the advantages (e.g., usefulness for finding hidden relationships) and disadvantages (e.g., cognitive load) of CMVs. But little empirical work exists on the impact of the number of views on visual anlaysis results and processes, which results in uncertainty in the relationship between the view number and visual anlaysis. In this work, we aim at investigating the relationship between the number of coordinated views and users analytic processes and results. To achieve the goal, we implemented a CMV tool for visual anlaysis. We also provided visualization duplication in the tool to help users easily create a desired number of visualization views on-the-fly. We conducted a between-subject study with 44 participants, where we asked participants to solve five analytic problems using the visual tool. Through quantitative and qualitative analysis, we discovered the positive correlation between the number of views and analytic results. We also found that visualization duplication encourages users to create more views and to take various analysis strategies. Based on the results, we provide implications and limitations of our study.
AI Key Findings
Get AI-generated insights about this paper's methodology, results, significance, and more — seven facets brought into focus.
Impact
Paper Details
Authors
PDF Preview
Key Terms
Citation Network
Current paper (gray), citations (green), references (blue)
Display is limited for performance on very large graphs.
Discussion 0