An Epsilon Hierarchical Fuzzy Twin Support Vector Regression
Publication
Metrics
AI Quick Summary
This paper introduces epsilon hierarchical fuzzy twin support vector regression (epsilon HFTSVR), combining epsilon fuzzy twin support vector regression (epsilon FTSVR) and epsilon twin support vector regression to handle forecasting uncertainties. The method enhances regression performance through hierarchical layers and structural risk minimization, showing superior generalization and efficiency in experiments.
Paper Preview
Abstract
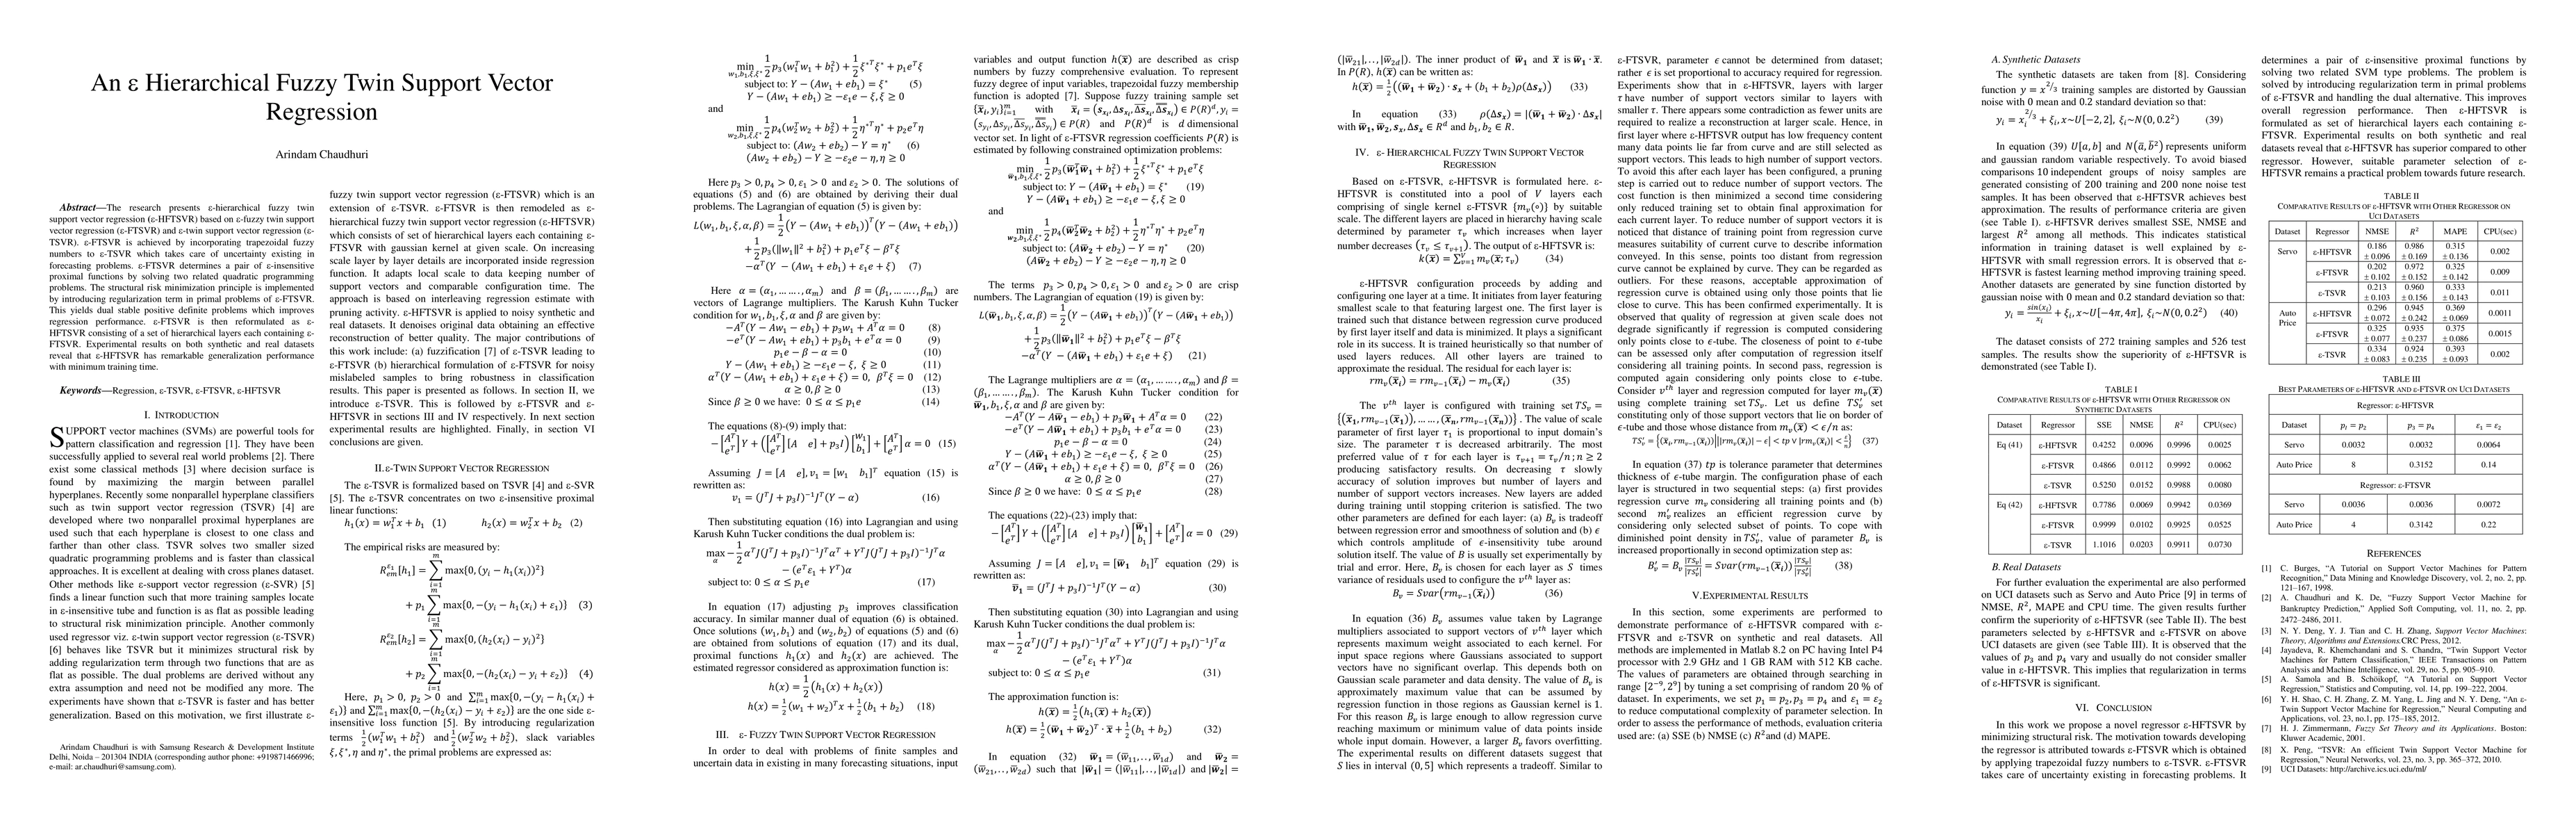
The research presents epsilon hierarchical fuzzy twin support vector regression based on epsilon fuzzy twin support vector regression and epsilon twin support vector regression. Epsilon FTSVR is achieved by incorporating trapezoidal fuzzy numbers to epsilon TSVR which takes care of uncertainty existing in forecasting problems. Epsilon FTSVR determines a pair of epsilon insensitive proximal functions by solving two related quadratic programming problems. The structural risk minimization principle is implemented by introducing regularization term in primal problems of epsilon FTSVR. This yields dual stable positive definite problems which improves regression performance. Epsilon FTSVR is then reformulated as epsilon HFTSVR consisting of a set of hierarchical layers each containing epsilon FTSVR. Experimental results on both synthetic and real datasets reveal that epsilon HFTSVR has remarkable generalization performance with minimum training time.
AI Key Findings
Get AI-generated insights about this paper's methodology, results, significance, and more — seven facets brought into focus.
Impact
Paper Details
PDF Preview
Key Terms
Citation Network
Current paper (gray), citations (green), references (blue)
Display is limited for performance on very large graphs.
Discussion 0