Background
Bayesian belief networks BLNs are graphical models that encode probabilistic dependencies among variables with a directed acyclic graph and conditional probability distributions. Learning the network structure from data—often called Bayesian learning of belief networks BLN—uses search strategies and scoring functions to identify the most probable network given observations. A notable instantiation is K2, which employs a greedy search constrained by a user-provided ordering of the variables such that later variables cannot be parents of earlier ones. This restriction enforces acyclicity and can reflect temporal or domain-driven precedence.
The challenge addressed in this work is to quantify how accurately K2 can recover the underlying BN structure when trained on data. Real-world data rarely come with a known gold standard BN, making direct assessment difficult. By contrast, simulated data generated from gold standard networks offers a direct way to measure structural learning accuracy and understand how data attributes influence performance.
Problem / Research Question
The central question is: How accurately does K2 induce the generating BN from simulated data, and which data characteristics (eg, number of variables, variable arity, number of arcs, sample size) most strongly affect accuracy? A secondary goal is to develop a simple predictive model that can estimate K2’s expected accuracy given observable data attributes, enabling users to forecast performance on their tasks.
Innovation / Contribution
The paper contributes a systematic empirical evaluation of K2 across a diverse set of gold standard BNs, generated and evaluated under a controlled simulation framework. It also introduces a data-driven accuracy model that links dataset characteristics to expected structural recovery, a feature that helps practitioners anticipate performance and plan data collection. Additionally, the work discusses practical limitations of the ordering assumption and suggests directions for relaxing this constraint and integrating missing value handling in future studies.
Methodology / Approach
The experimental design comprises four steps. First, generate a set of gold standard BNs (BNs-GS) with 2, 10, 20, 30, 40, or 50 variables; arcs are assigned randomly so that each node receives between 0 and 10 incoming arcs; each variable has an arity of 2 or 3 values. Conditional probability tables are randomized for all nodes.
Second, for each BN-GS, create a data set by logic sampling to produce a number of cases randomly chosen between 0 and 2000.
Third, feed each data set to K2, which is supplied with the correct ordering of the variables for the corresponding BN-GS, and obtain an induced BN (BN-1).
Fourth, compare BN-1 to BN-GS using two metrics: Ml, the percentage of BN-GS arcs present in BN-1, and M2, the ratio of extra arcs in BN-1 not present in BN-GS to the number of BN-GS arcs.
The experiments were implemented in a Pascal-based software package running on an IBM RS 6000, with batch processing and a focus on controlled, repeatable evaluation.
In addition to performance metrics, the authors built an empirical BN model describing how accuracy depends on data attributes. They also discuss the practical limitation that the ordering assumption may be relaxed by alternate search methods or by generating multiple random orderings and selecting the best result.
Experiments / Evaluation
A total of 67 BN-GS pairs were evaluated. Descriptive statistics were computed for data attributes (number of variables, variable ordinality, number of arcs, number of cases) and for the evaluation metrics Ml and M2. Results show that K2 typically identifies a large portion of true arcs: mean Ml around 91.6%; mean M2 around 4.7%, indicating relatively few superfluous arcs. A striking empirical finding is that in 94% of the cases, K2 discovers at least 70% of the arcs, and in the same proportion of cases it adds no more than 10% extra arcs beyond the GS.
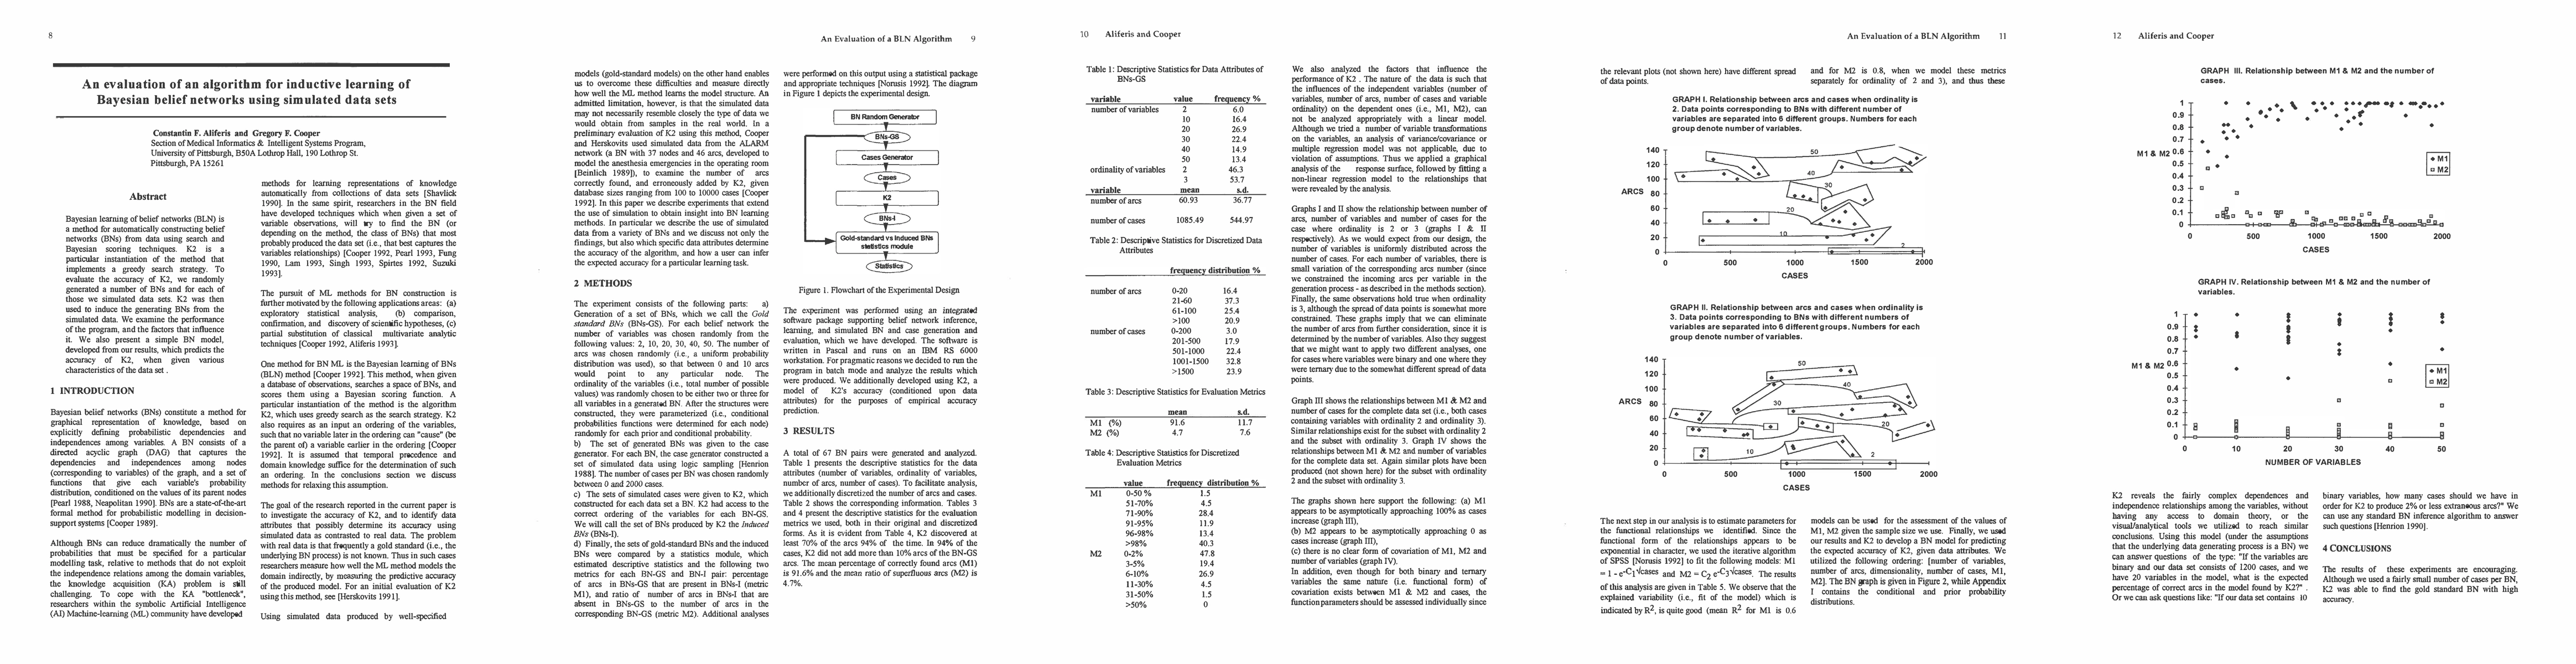
The paper includes a non-linear regression analysis linking Ml and M2 to the number of cases, suggesting an exponential learning behavior: Ml ≈ 1 − exp(−C1 × cases), with parameter estimates depending on whether variables are binary or trinary. A BN-model figure (Figure 2) illustrates how data attributes influence the inferred network, supporting the claim that data volume materially governs accuracy. The authors also provide a discussion of future directions, including evaluating alternative search strategies that relax the strict ordering constraint and addressing missing data as described in subsequent work.
Key Results
The core quantitative findings are: 67 BN-GS pairs analyzed; mean Ml ≈ 91.6%; mean M2 ≈ 4.7%; 70% of GS arcs recovered in 94% of cases; extra arcs kept to a minimum in most experiments. The results support that K2, given a correct variable ordering, can reliably reconstruct a large portion of the underlying structure from simulated data and that dataset size strongly modulates accuracy. The regression analyses indicate that accuracy improves with more cases and that the rate of improvement can differ by variable arity (binary vs trinary).
Practical Applications
This work provides researchers and practitioners with a benchmark for BN structure learning using K2 on simulated data, helping them gauge whether their data volumes will support reliable structure discovery. The explicit predictive model for accuracy offers a practical tool to estimate the expected quality of learned networks before running expensive experiments. The findings also guide experimental design, suggesting that increasing the number of cases yields diminishing returns after certain thresholds, and highlight the importance of obtaining a sensible variable ordering or exploring methods to relax that constraint.
Limitations & Considerations
Several caveats shape the interpretation and generalizability of the results. The experiments assume no missing values, a fixed ordering of variables, and a particular randomization of network structure and parameters that may not capture all real-world complexities. K2’s reliance on a correct ordering is a central constraint; the authors acknowledge that alternative heuristic searches or multiple random orderings could mitigate this limitation but were not the focus of the current study. The simulated networks used may not fully reflect the diversity of real domains, and the authors note that parameterizations were randomly chosen, which may affect how well the findings transfer to real processes. Finally, scalability beyond the tested network sizes and data regimes, and performance under missing or noisy data, remain open questions for future work.
Discussion 0