An interactive, comparative and quantitative 3D visualization system for large-scale spectral-cube surveys using CAVE2
Publication
Metrics
AI Quick Summary
This paper introduces an advanced 3D visualization system for large-scale spectral-cube surveys using CAVE2, an immersive environment with high-resolution displays and substantial computational power, enabling comparative analysis of up to 100 spectral-cubes simultaneously. The system facilitates real-time data manipulation and quantitative analysis, potentially accelerating astronomical discoveries.
Paper Preview
Abstract
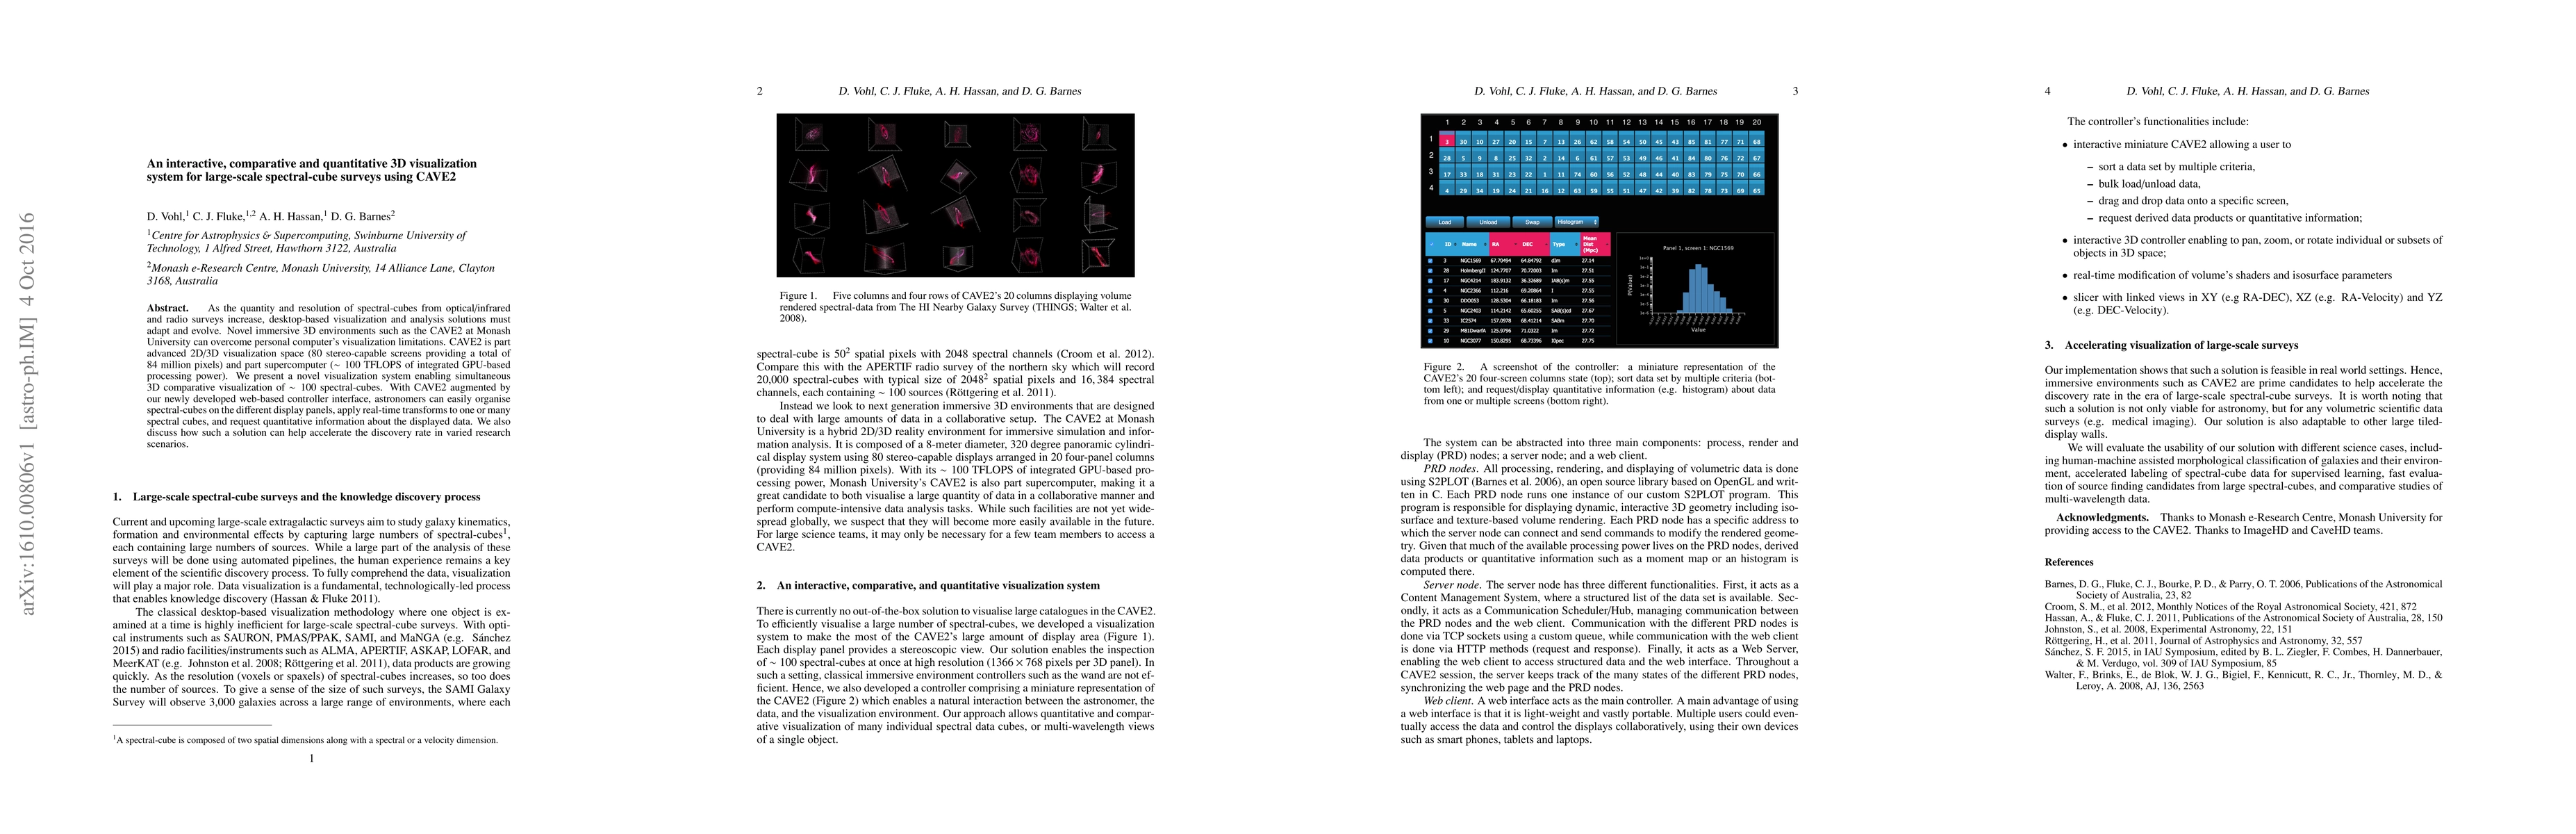
As the quantity and resolution of spectral-cubes from optical/infrared and radio surveys increase, desktop-based visualization and analysis solutions must adapt and evolve. Novel immersive 3D environments such as the CAVE2 at Monash University can overcome personal computer's visualization limitations. CAVE2 is part advanced 2D/3D visualization space (80 stereo-capable screens providing a total of 84 million pixels) and part supercomputer ($\sim100$ TFLOPS of integrated GPU-based processing power). We present a novel visualization system enabling simultaneous 3D comparative visualization of $\sim100$ spectral-cubes. With CAVE2 augmented by our newly developed web-based controller interface, astronomers can easily organise spectral-cubes on the different display panels, apply real-time transforms to one or many spectral cubes, and request quantitative information about the displayed data. We also discuss how such a solution can help accelerate the discovery rate in varied research scenarios.
AI Key Findings
Get AI-generated insights about this paper's methodology, results, significance, and more — seven facets brought into focus.
Paper Details
PDF Preview
Key Terms
Citation Network
Current paper (gray), citations (green), references (blue)
Display is limited for performance on very large graphs.
Related Papers
No references found for this paper.
Discussion 0