An Olfactory EEG Signal Classification Network Based on Frequency Band Feature Extraction
Publication
Metrics
AI Quick Summary
This research introduces a novel classification network for olfactory-induced EEG signals, emphasizing the extraction of specific frequency bands for improved performance. The method employs a frequency band generator and a frequency band attention mechanism to optimize for subject-specific information, followed by a convolutional neural network to extract spatio-spectral features. Experimental results indicate superior classification quality and robustness compared to baseline methods.
Paper Preview
Abstract
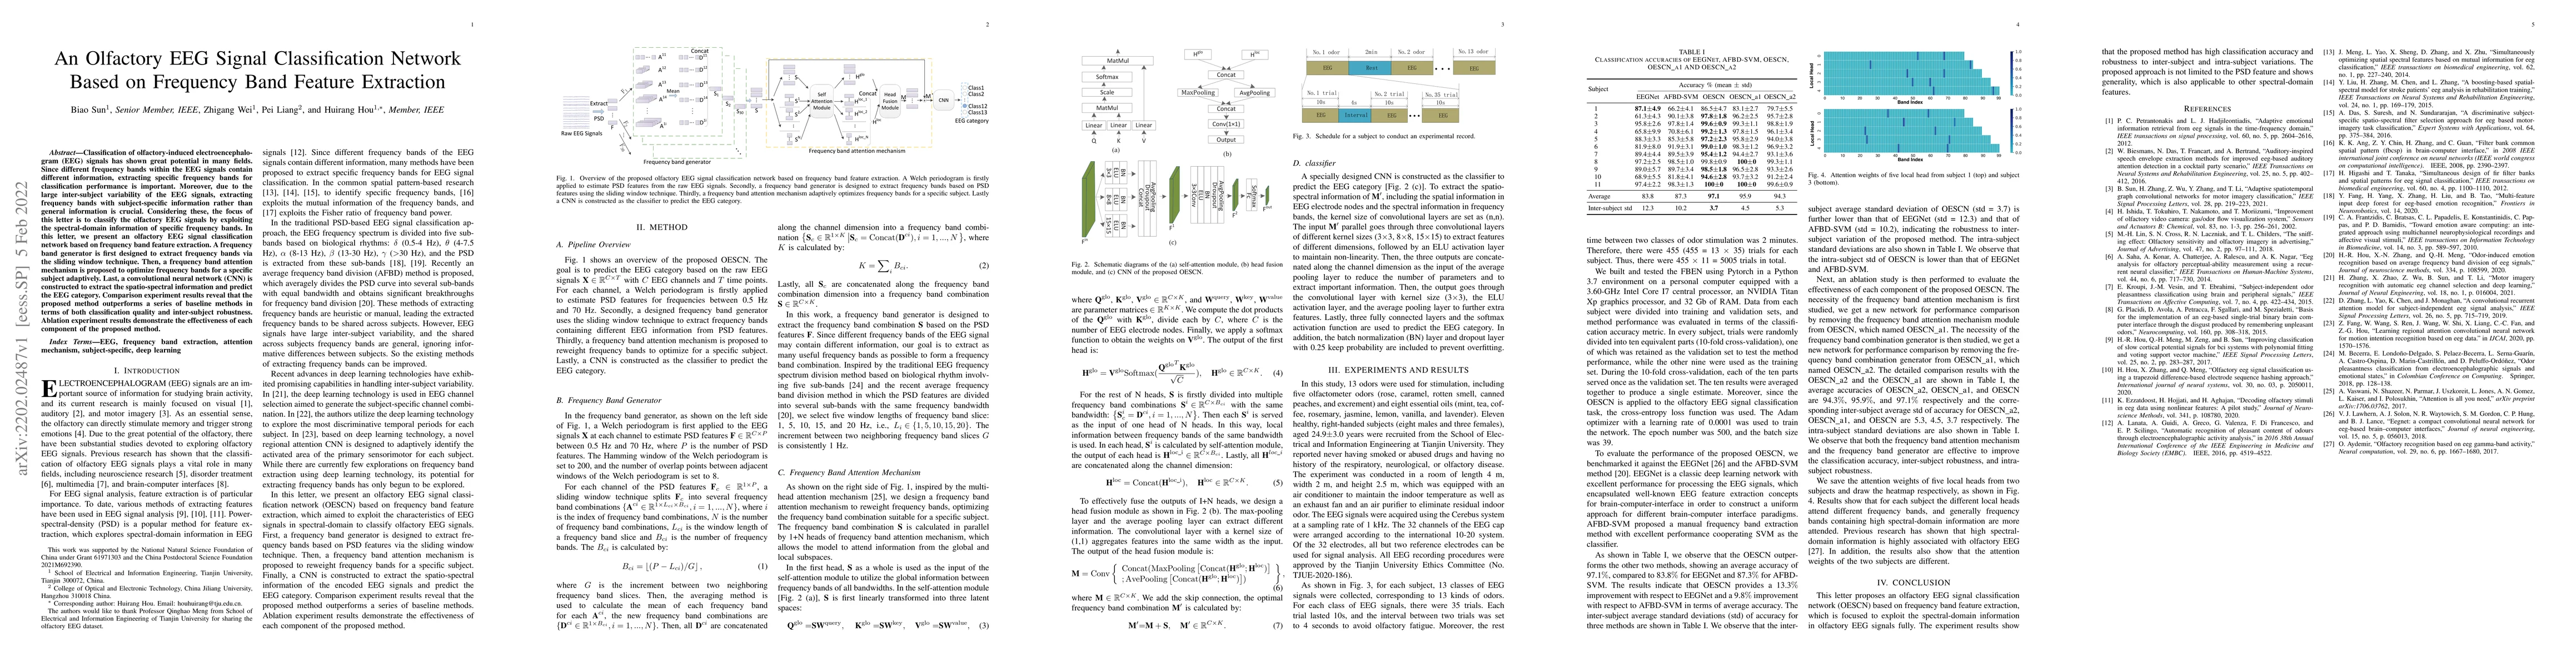
Classification of olfactory-induced electroencephalogram (EEG) signals has shown great potential in many fields. Since different frequency bands within the EEG signals contain different information, extracting specific frequency bands for classification performance is important. Moreover, due to the large inter-subject variability of the EEG signals, extracting frequency bands with subject-specific information rather than general information is crucial. Considering these, the focus of this letter is to classify the olfactory EEG signals by exploiting the spectral-domain information of specific frequency bands. In this letter, we present an olfactory EEG signal classification network based on frequency band feature extraction. A frequency band generator is first designed to extract frequency bands via the sliding window technique. Then, a frequency band attention mechanism is proposed to optimize frequency bands for a specific subject adaptively. Last, a convolutional neural network (CNN) is constructed to extract the spatio-spectral information and predict the EEG category. Comparison experiment results reveal that the proposed method outperforms a series of baseline methods in terms of both classification quality and inter-subject robustness. Ablation experiment results demonstrate the effectiveness of each component of the proposed method.
AI Key Findings
Get AI-generated insights about this paper's methodology, results, significance, and more — seven facets brought into focus.
Impact
Paper Details
Authors
PDF Preview
Key Terms
Citation Network
Current paper (gray), citations (green), references (blue)
Display is limited for performance on very large graphs.
Discussion 0