Analysing and visualising bike-sharing demand with outliers
Publication
Metrics
AI Quick Summary
This paper develops methods to identify outliers in bike-sharing demand using clustering and functional depth analysis, and applies these techniques to Washington D.C.'s Capital Bikeshare data. It also provides visualizations to highlight demand patterns and offers planning recommendations based on the findings.
Paper Preview
Abstract
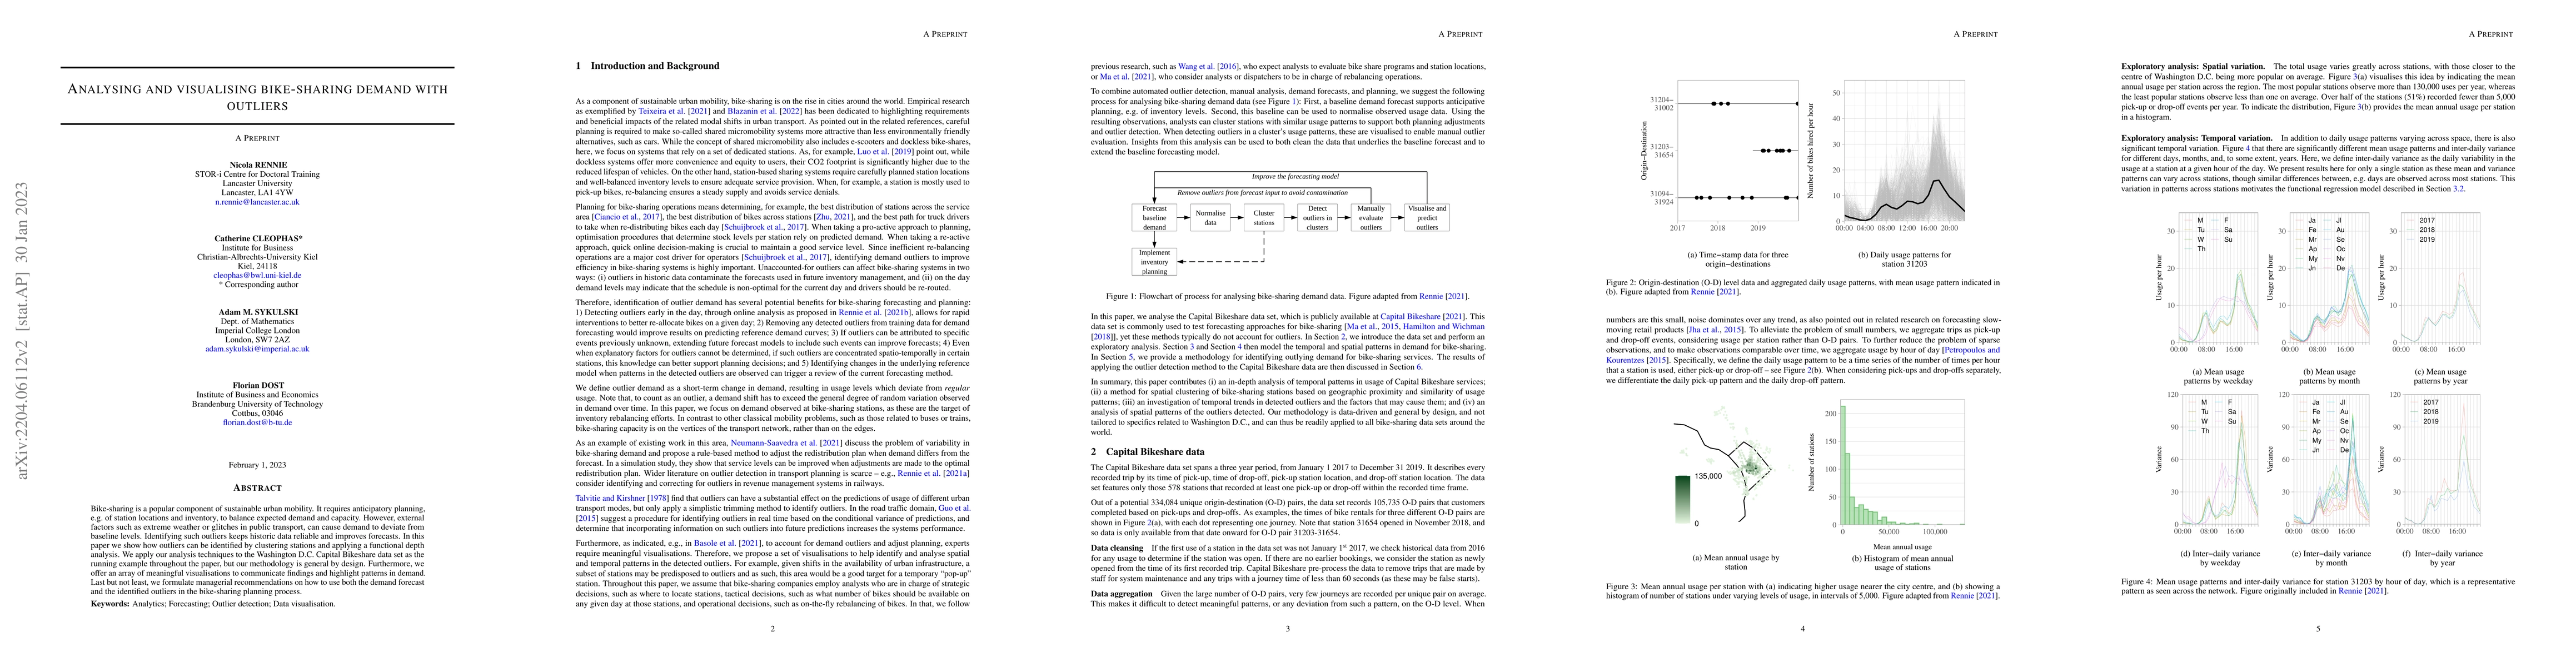
Bike-sharing is a popular component of sustainable urban mobility. It requires anticipatory planning, e.g. of station locations and inventory, to balance expected demand and capacity. However, external factors such as extreme weather or glitches in public transport, can cause demand to deviate from baseline levels. Identifying such outliers keeps historic data reliable and improves forecasts. In this paper we show how outliers can be identified by clustering stations and applying a functional depth analysis. We apply our analysis techniques to the Washington D.C. Capital Bikeshare data set as the running example throughout the paper, but our methodology is general by design. Furthermore, we offer an array of meaningful visualisations to communicate findings and highlight patterns in demand. Last but not least, we formulate managerial recommendations on how to use both the demand forecast and the identified outliers in the bike-sharing planning process.
AI Key Findings
Get AI-generated insights about this paper's methodology, results, significance, and more — seven facets brought into focus.
Impact
Paper Details
Authors
PDF Preview
Key Terms
Citation Network
Current paper (gray), citations (green), references (blue)
Display is limited for performance on very large graphs.
Discussion 0