Publication
Metrics
AI Quick Summary
Researchers propose a new method to analyze networks of networks by transforming multiple networks into a single multilevel network using line graphs, enabling the study of associations between social networks and reports.
Paper Preview
Abstract
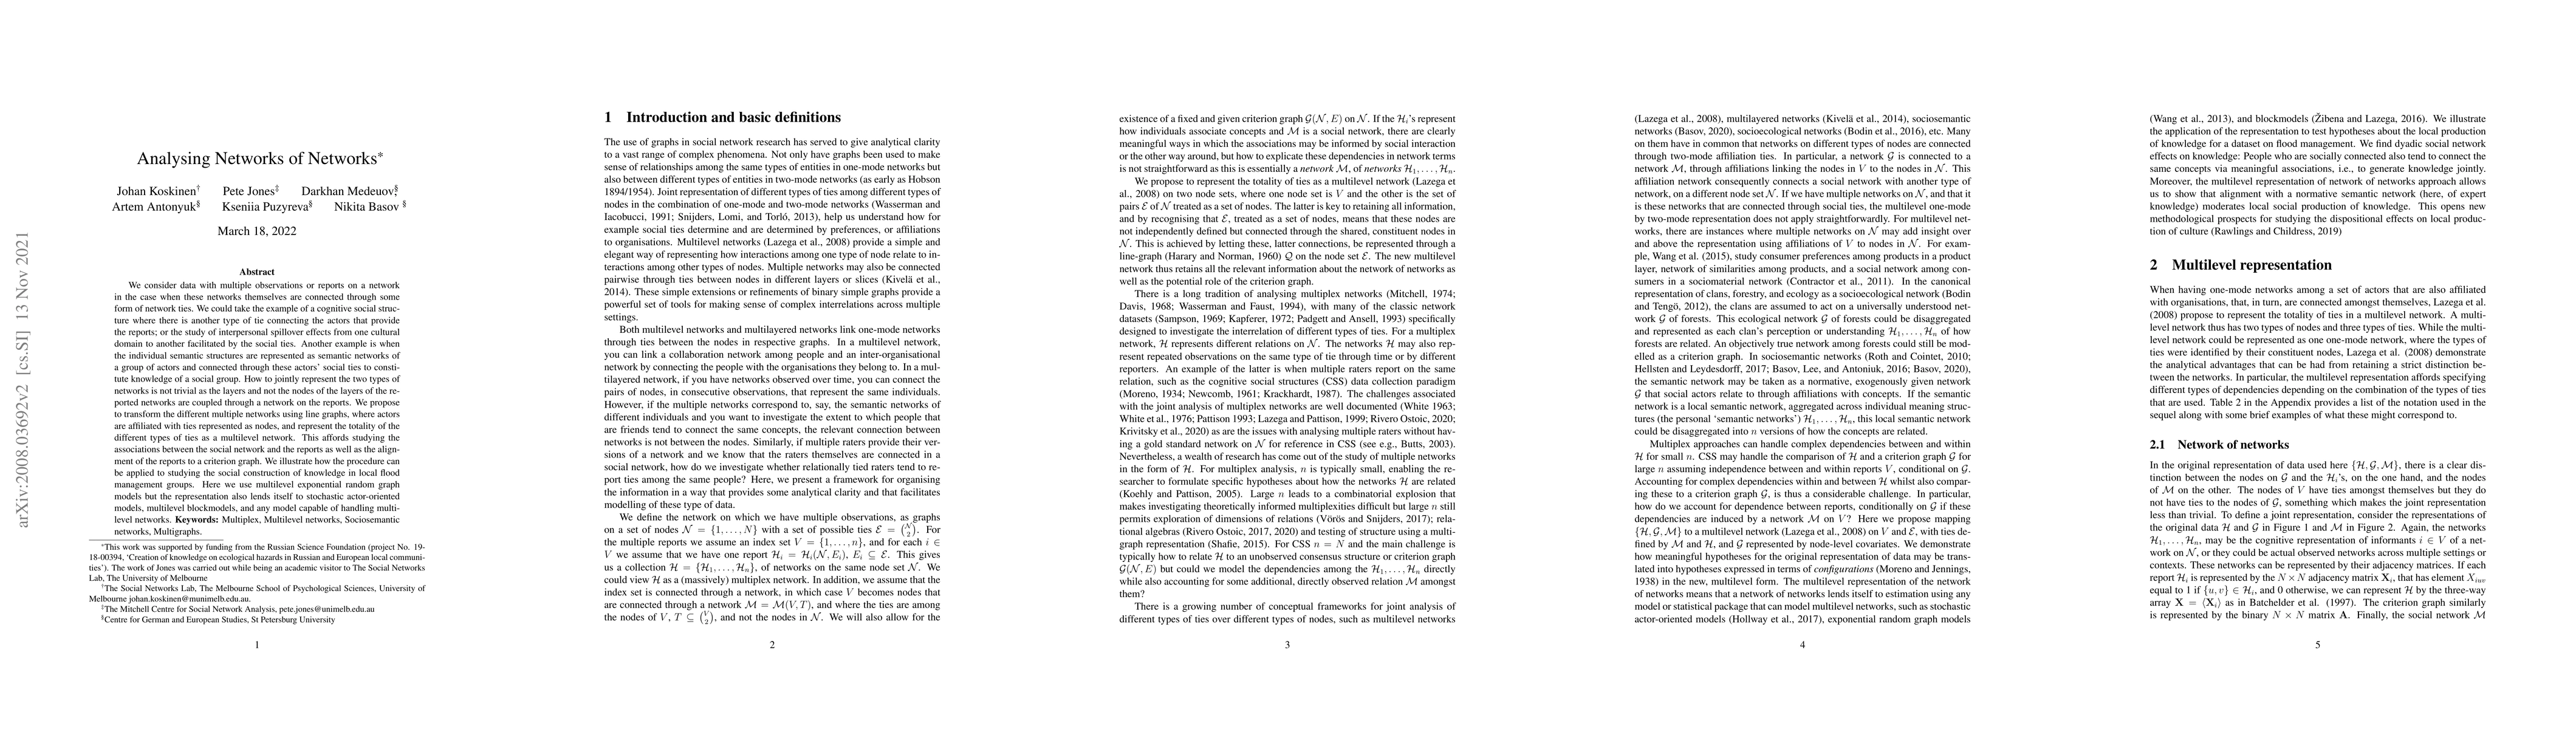
We consider data with multiple observations or reports on a network in the case when these networks themselves are connected through some form of network ties. We could take the example of a cognitive social structure where there is another type of tie connecting the actors that provide the reports; or the study of interpersonal spillover effects from one cultural domain to another facilitated by the social ties. Another example is when the individual semantic structures are represented as semantic networks of a group of actors and connected through these actors' social ties to constitute knowledge of a social group. How to jointly represent the two types of networks is not trivial as the layers and not the nodes of the layers of the reported networks are coupled through a network on the reports. We propose to transform the different multiple networks using line graphs, where actors are affiliated with ties represented as nodes, and represent the totality of the different types of ties as a multilevel network. This affords studying the associations between the social network and the reports as well as the alignment of the reports to a criterion graph. We illustrate how the procedure can be applied to studying the social construction of knowledge in local flood management groups. Here we use multilevel exponential random graph models but the representation also lends itself to stochastic actor-oriented models, multilevel blockmodels, and any model capable of handling multilevel networks.
AI Key Findings
Get AI-generated insights about this paper's methodology, results, significance, and more — seven facets brought into focus.
Impact
Paper Details
Authors
PDF Preview
Key Terms
Citation Network
Current paper (gray), citations (green), references (blue)
Display is limited for performance on very large graphs.
Discussion 0