Analysing ocular parameters for web browsing and graph visualization
Publication
Metrics
AI Quick Summary
This paper investigates eye gaze patterns during web browsing and graph visualization, proposing new design guidelines to avoid deceptive web materials and enhance user-friendly data representation. Findings suggest area graphs are most effective, and a web-based data visualization tool for eye tracking analysis was developed.
Paper Preview
Abstract
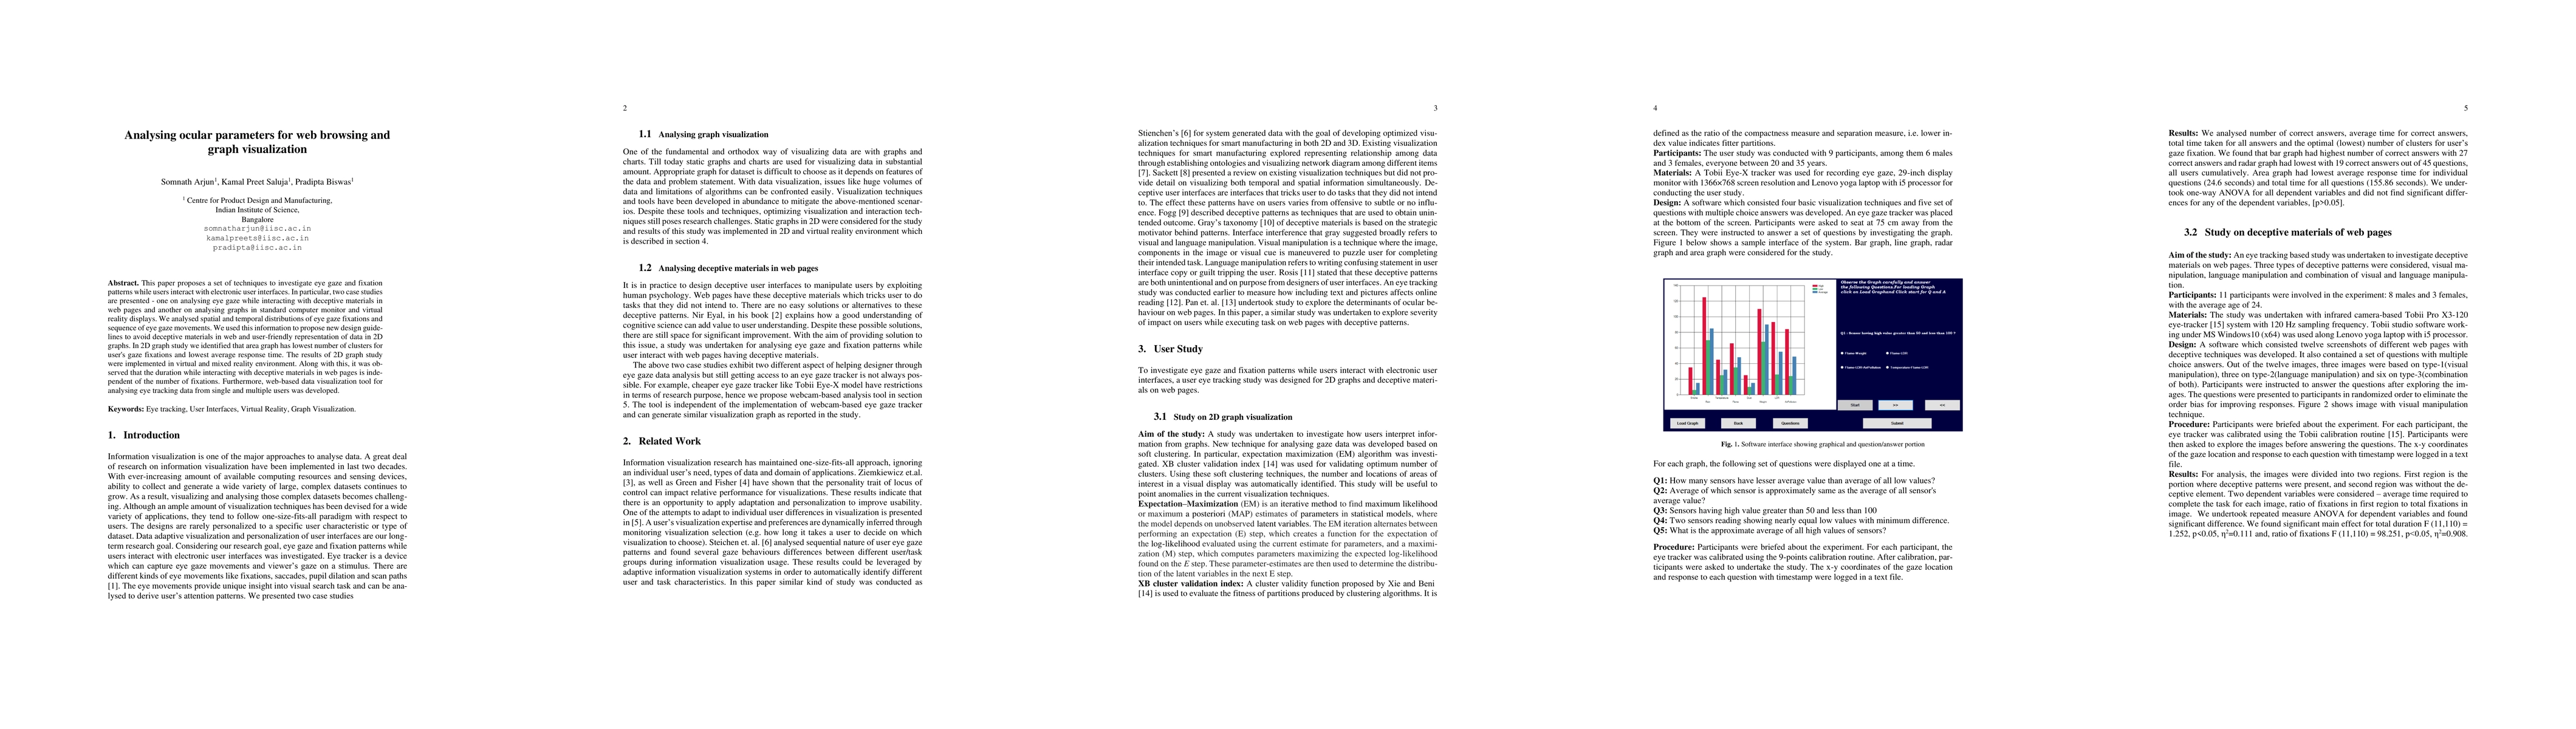
This paper proposes a set of techniques to investigate eye gaze and fixation patterns while users interact with electronic user interfaces. In particular, two case studies are presented - one on analysing eye gaze while interacting with deceptive materials in web pages and another on analysing graphs in standard computer monitor and virtual reality displays. We analysed spatial and temporal distributions of eye gaze fixations and sequence of eye gaze movements. We used this information to propose new design guidelines to avoid deceptive materials in web and user-friendly representation of data in 2D graphs. In 2D graph study we identified that area graph has lowest number of clusters for user's gaze fixations and lowest average response time. The results of 2D graph study were implemented in virtual and mixed reality environment. Along with this, it was ob-served that the duration while interacting with deceptive materials in web pages is independent of the number of fixations. Furthermore, web-based data visualization tool for analysing eye tracking data from single and multiple users was developed.
AI Key Findings
Get AI-generated insights about this paper's methodology, results, significance, and more — seven facets brought into focus.
Impact
Paper Details
Authors
PDF Preview
Key Terms
Citation Network
Current paper (gray), citations (green), references (blue)
Display is limited for performance on very large graphs.
Discussion 0