Publication
Metrics
AI Quick Summary
This paper analyzes the Galactic bulge's structure using Mira variables from the OGLE-IV data, finding a boxy bulge model is significantly more probable than an X-shaped model, with a 4.7σ tension against the latter. Thus, a boxy bulge is favored for describing the bulge, though no model can be completely ruled out.
Paper Preview
Abstract
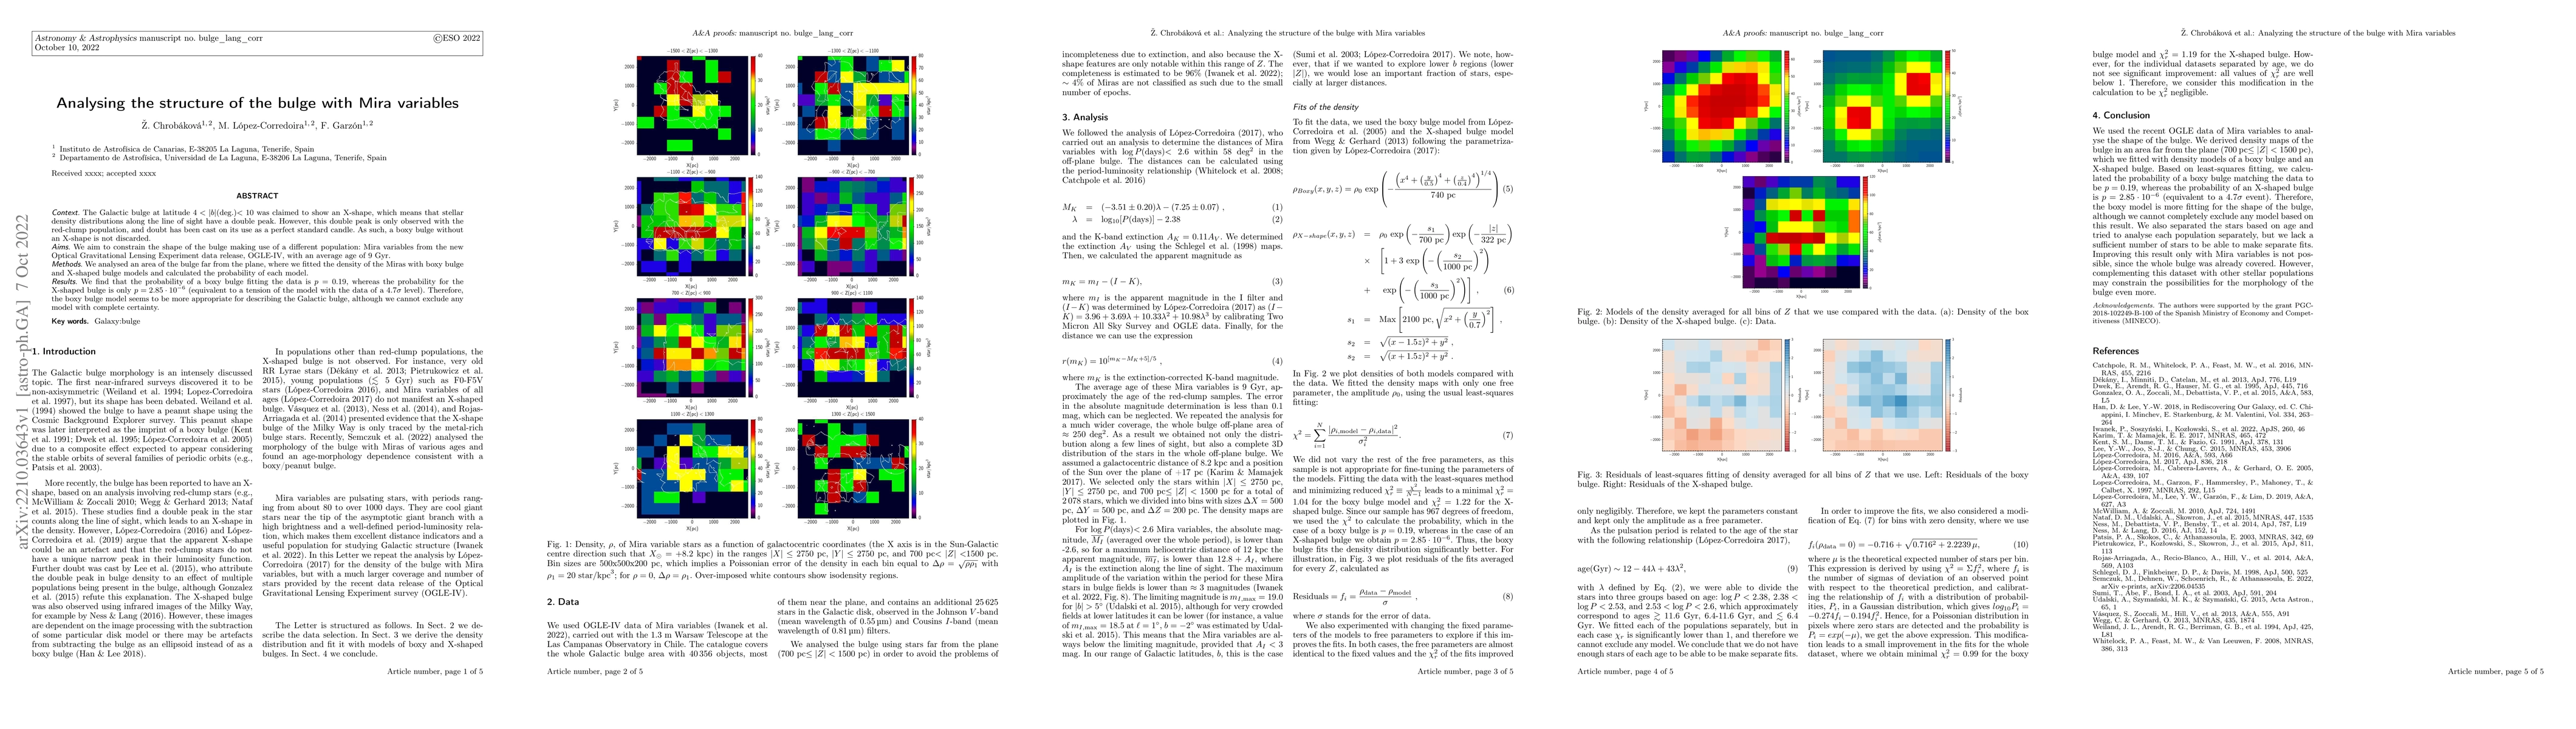
The Galactic bulge at latitude $4<|b|$(deg.)$<10$ was claimed to show an X-shape, which means that stellar density distributions along the line of sight have a double peak. However, this double peak is only observed with the red-clump population, and doubt has been cast on its use as a perfect standard candle.\ As such, a boxy bulge without an X-shape is not discarded. We aim to constrain the shape of the bulge making use of a different population: Mira variables from the new Optical Gravitational Lensing Experiment data release, OGLE-IV, with an average age of 9 Gyr. We analysed an area of the bulge far from the plane, where we fitted the density of the Miras with boxy bulge and X-shaped bulge models and calculated the probability of each model. We find that the probability of a boxy bulge fitting the data is $p=0.19$, whereas the probability for the X-shaped bulge is only $p=2.85 \cdot 10^{-6}$ (equivalent to a tension of the model with the data of a 4.7$\sigma $ level). Therefore, the boxy bulge model seems to be more appropriate for describing the Galactic bulge, although we cannot exclude any model with complete certainty.
AI Key Findings
Get AI-generated insights about this paper's methodology, results, significance, and more — seven facets brought into focus.
Paper Details
Authors
PDF Preview
Key Terms
Related Papers
No references found for this paper.
Discussion 0