Analysis and sample size calculation within the responder stratified exponential survival model
Publication
Metrics
AI Quick Summary
This paper proposes a responder stratified exponential survival model for oncology trials using a binary surrogate endpoint, and develops methods for sample size calculation and analysis. It introduces new tests for survival differences, demonstrating that the exact test outperforms the logrank test in terms of power and accuracy.
Paper Preview
Abstract
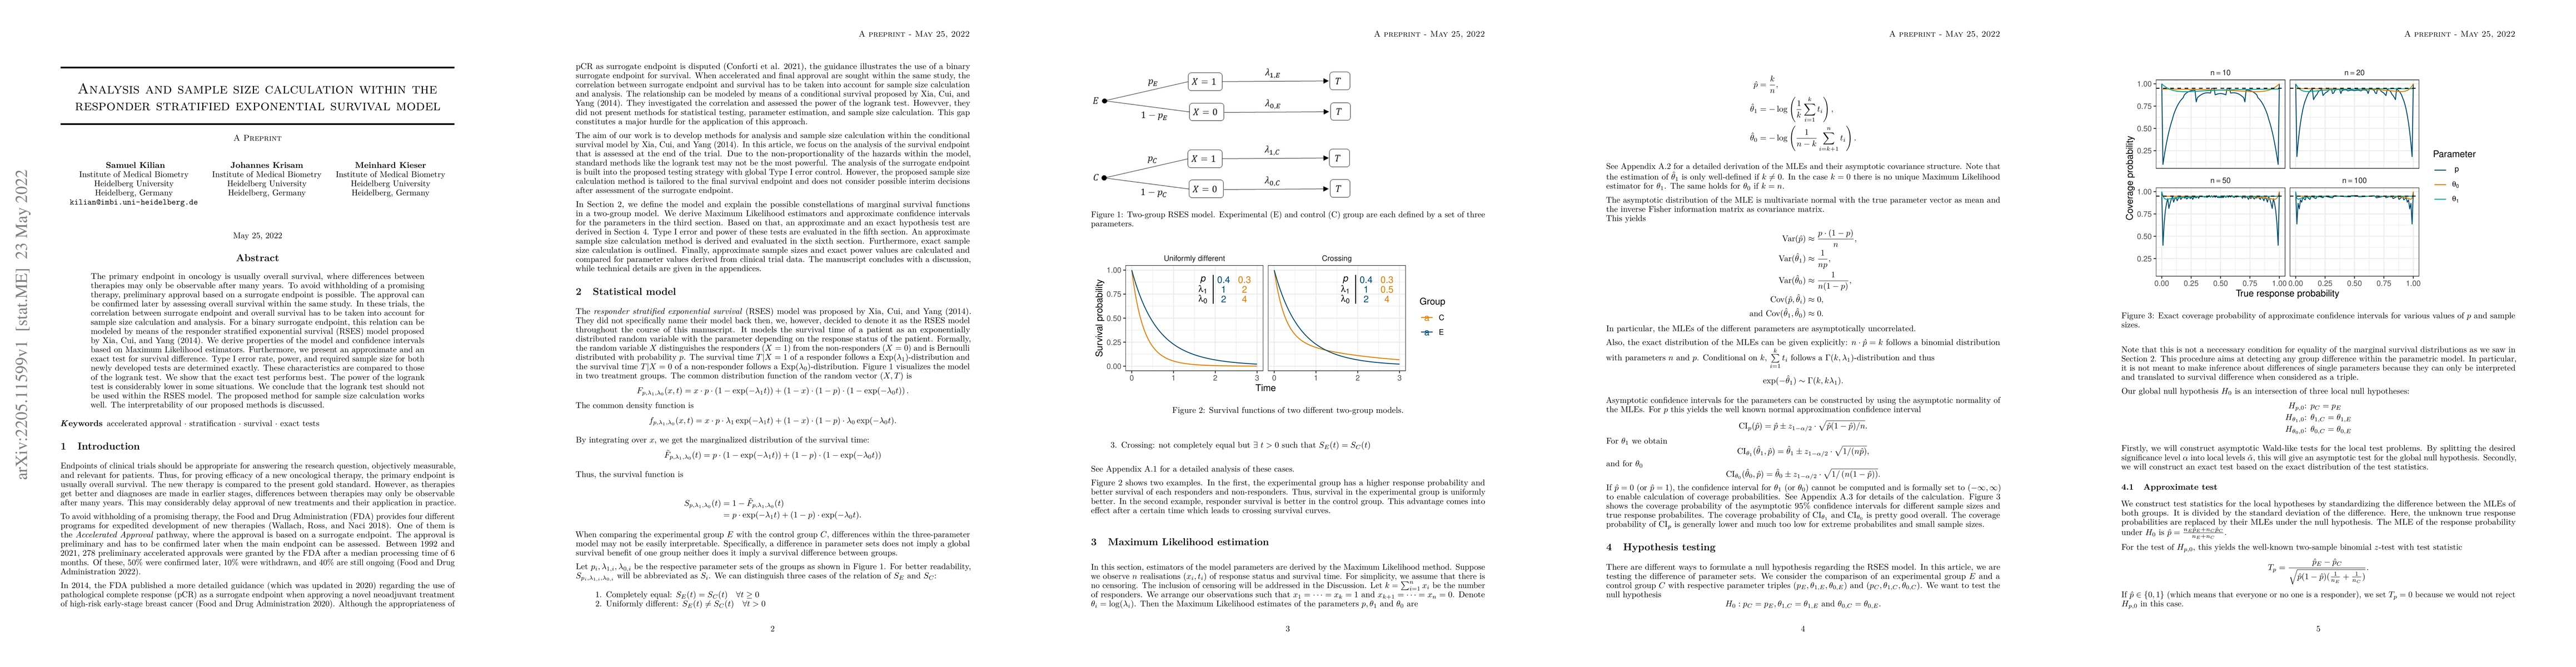
The primary endpoint in oncology is usually overall survival, where differences between therapies may only be observable after many years. To avoid withholding of a promising therapy, preliminary approval based on a surrogate endpoint is possible. The approval can be confirmed later by assessing overall survival within the same study. In these trials, the correlation between surrogate endpoint and overall survival has to be taken into account for sample size calculation and analysis. For a binary surrogate endpoint, this relation can be modeled by means of the responder stratified exponential survival (RSES) model proposed by Xia, Cui, and Yang (2014). We derive properties of the model and confidence intervals based on Maximum Likelihood estimators. Furthermore, we present an approximate and an exact test for survival difference. Type I error rate, power, and required sample size for both newly developed tests are determined exactly. These characteristics are compared to those of the logrank test. We show that the exact test performs best. The power of the logrank test is considerably lower in some situations. We conclude that the logrank test should not be used within the RSES model. The proposed method for sample size calculation works well. The interpretability of our proposed methods is discussed.
AI Key Findings
Get AI-generated insights about this paper's methodology, results, significance, and more — seven facets brought into focus.
Impact
Paper Details
Authors
PDF Preview
Key Terms
Citation Network
Current paper (gray), citations (green), references (blue)
Display is limited for performance on very large graphs.
Discussion 0