Analysis of a data matrix and a graph: Metagenomic data and the phylogenetic tree
Publication
Metrics
AI Quick Summary
Researchers used metagenomic data to analyze bacteria species in a sample, incorporating a phylogenetic tree into their analysis for more meaningful results. This approach effectively utilizes graphical information to produce better outcomes.
Paper Preview
Abstract
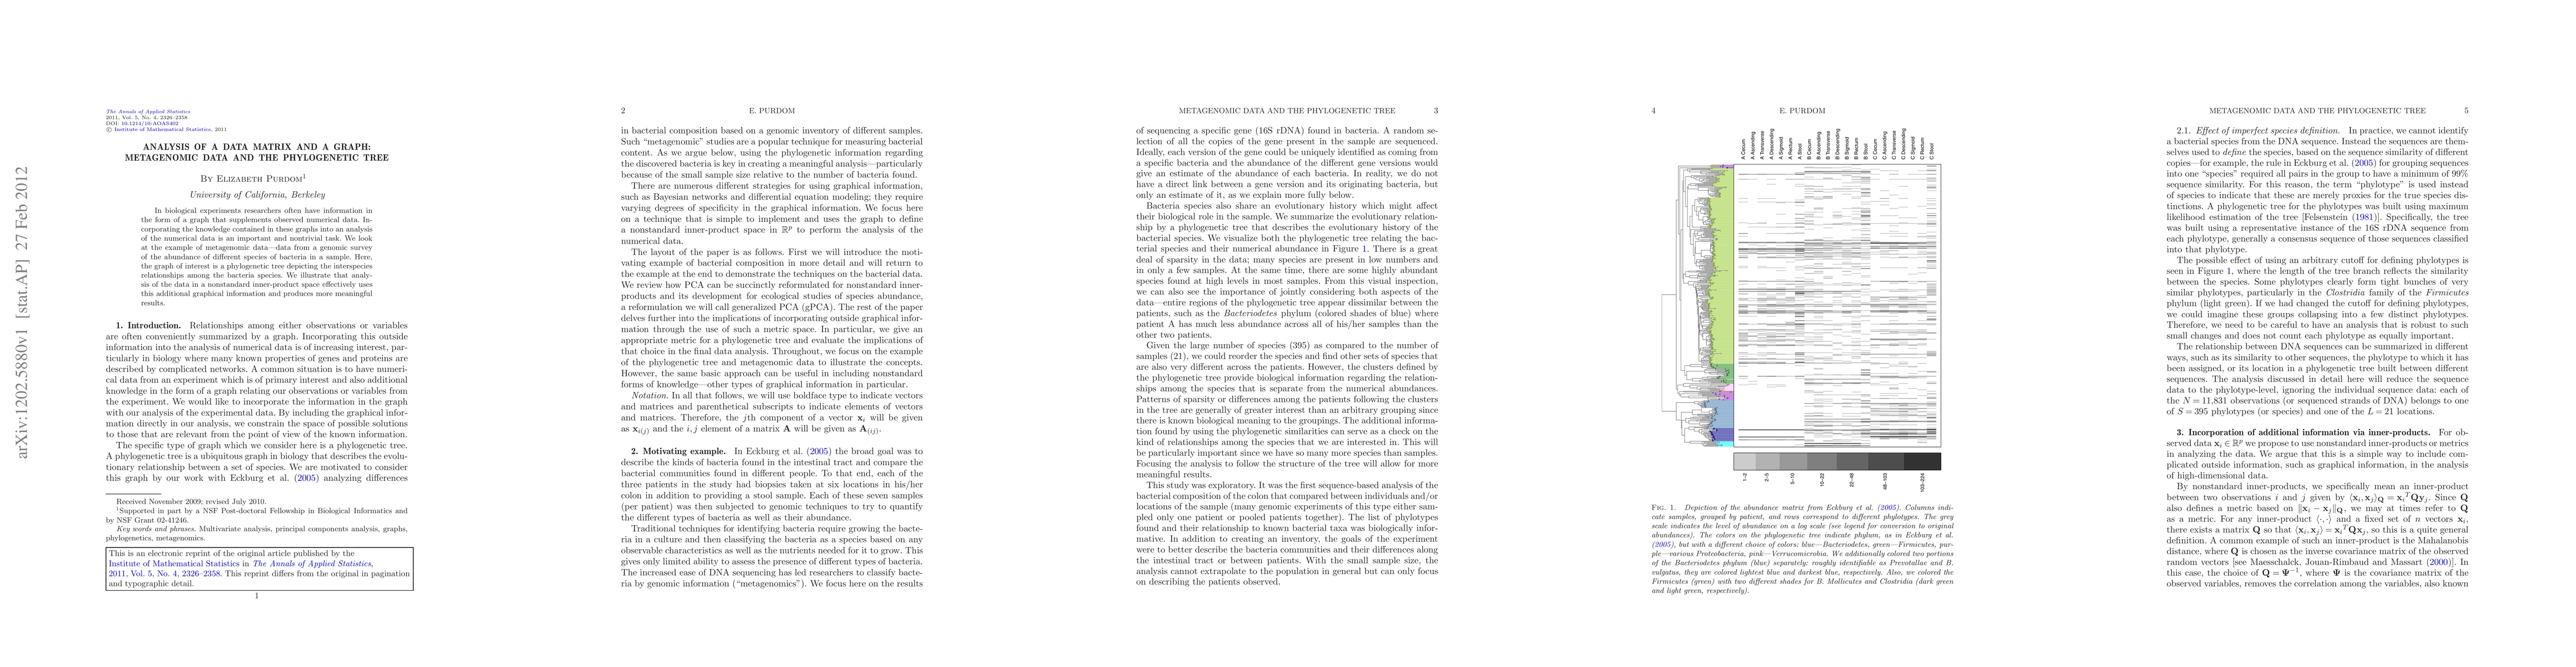
In biological experiments researchers often have information in the form of a graph that supplements observed numerical data. Incorporating the knowledge contained in these graphs into an analysis of the numerical data is an important and nontrivial task. We look at the example of metagenomic data---data from a genomic survey of the abundance of different species of bacteria in a sample. Here, the graph of interest is a phylogenetic tree depicting the interspecies relationships among the bacteria species. We illustrate that analysis of the data in a nonstandard inner-product space effectively uses this additional graphical information and produces more meaningful results.
AI Key Findings
Get AI-generated insights about this paper's methodology, results, significance, and more — seven facets brought into focus.
Impact
Paper Details
PDF Preview
Key Terms
Citation Network
Current paper (gray), citations (green), references (blue)
Display is limited for performance on very large graphs.
Discussion 0