ArxivLens
ArXiv q-bio.PE math.DS physics.soc-ph

Analysis of COVID-19 Infection Dynamics: Extended SIR Model Approach

Annie Cheng, Caleb Traxler, Minh Ton, Nameer Ahmed, Sasha Prostota

2505.13753 Published May 19, 2025
View PDF

Publication

Published: May 19, 2025
Updated: Jun 17, 2025
Categories: q-bio.PE, math.DS, physics.soc-ph

Metrics

Source: ArXiv

AI Quick Summary

Researchers analyzed COVID-19 infection dynamics using extended SIR models, finding that endemic states with stable spiral equilibria prevailed due to high reproduction numbers. Vaccination reduced the effective reproduction number below one, shifting towards a disease-free equilibrium.

Quick Answers

What is "Analysis of COVID-19 Infection Dynamics: Extended SIR Model Approach" about?

Researchers analyzed COVID-19 infection dynamics using extended SIR models, finding that endemic states with stable spiral equilibria prevailed due to high reproduction numbers. Vaccination reduced the effective reproduction number below one, shifting towards a disease-free equilibrium.

What methodology did the authors use?

The research employs extended SIR and SEIR models, incorporating demographic factors like birth and death rates, to analyze COVID-19 infection dynamics over four epidemic waves in Orange County, California, from January 2020 to March 2022. Stability and bifurcation analyses are performed using empirical data. More in Methodology →

What are the key results?

Reproduction numbers (R0) consistently exceed unity, indicating endemic states with stable spiral equilibria across all analyzed waves. — Vaccination is shown to potentially reduce the effective reproduction number below one, shifting the system towards a stable disease-free equilibrium. More in Key Results →

Why is this work significant?

This study provides actionable insights for public health interventions aimed at controlling and eventually eradicating COVID-19 by underscoring the importance of latency periods and vaccination in disease progression. More in Significance →

What are the main limitations?

The study is limited to data from Orange County, California, which may not be fully representative of global COVID-19 dynamics. — Model assumptions and simplifications may not capture all complexities of real-world disease transmission. More in Limitations →

Paper Preview

Abstract

This paper presents a detailed mathematical investigation into the dynamics of COVID-19 infections through extended Susceptible-Infected-Recovered (SIR) and Susceptible-Exposed-Infected-Recovered (SEIR) epidemiological models. By incorporating demographic factors such as birth and death rates, we enhance the classical Kermack-McKendrick framework to realistically represent long-term 
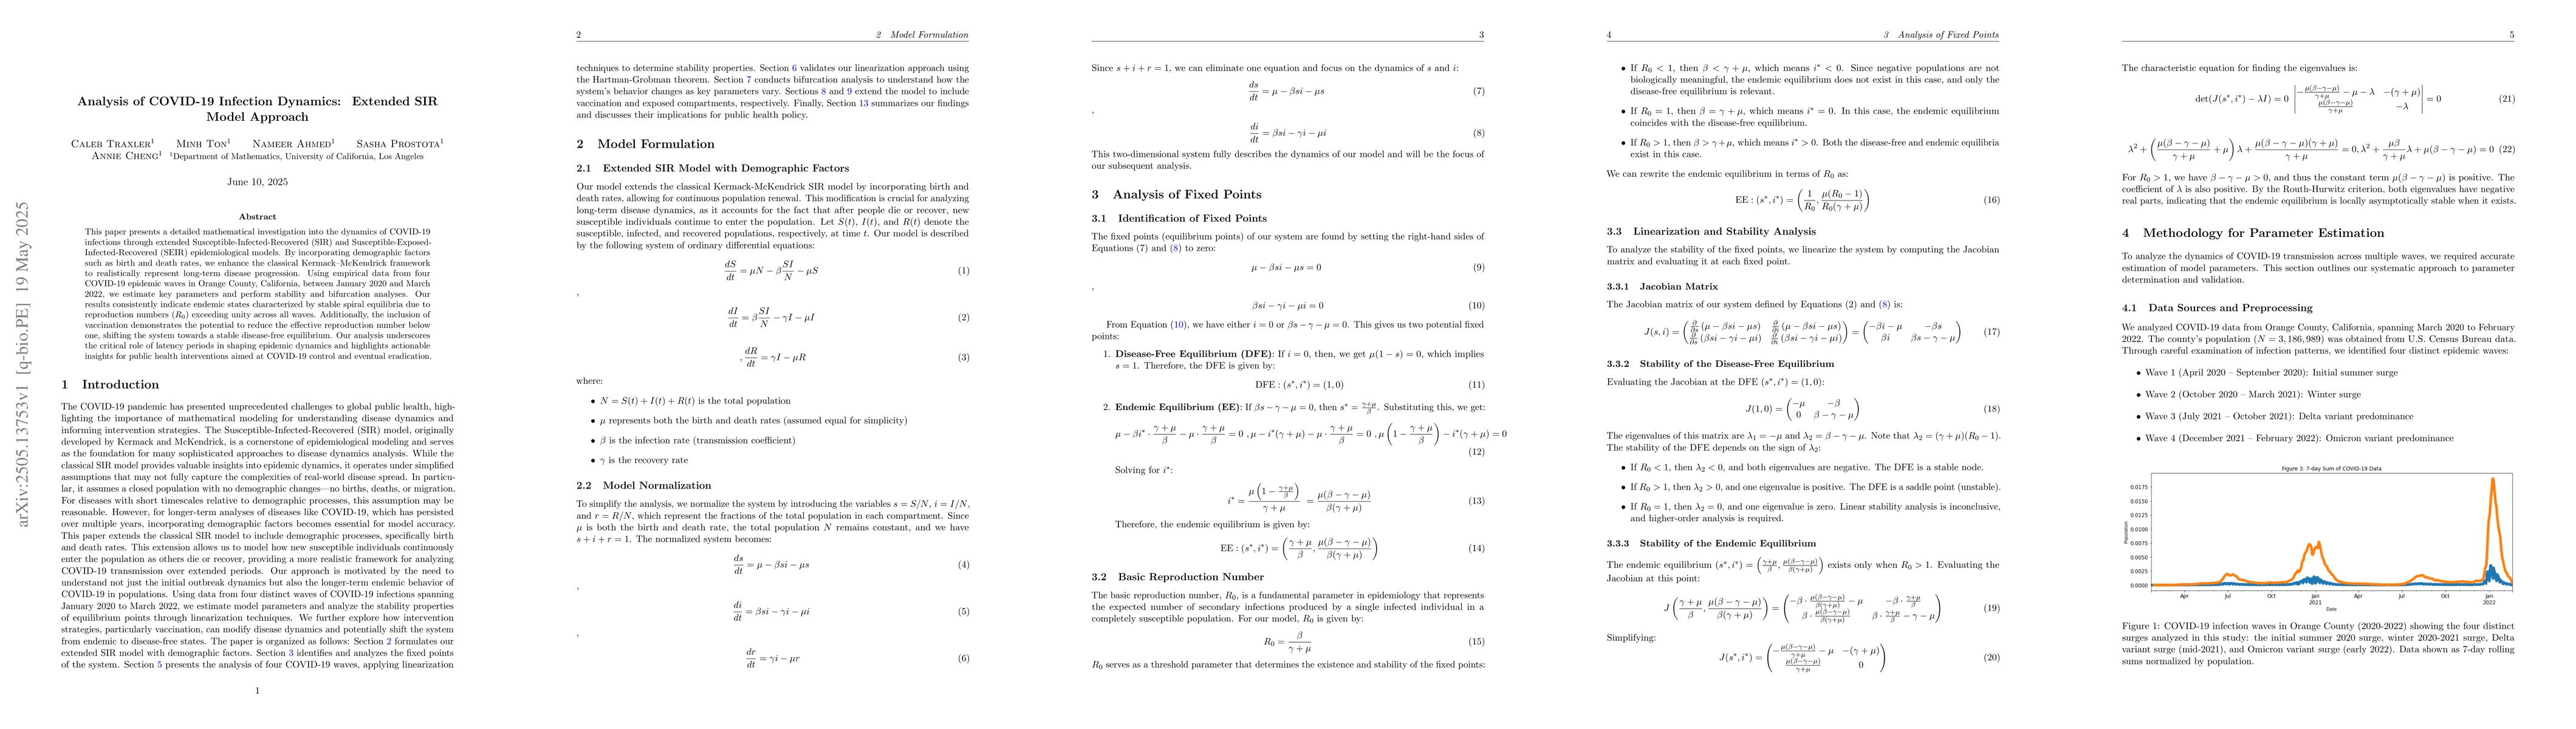
disease progression. Using empirical data from four COVID-19 epidemic waves in Orange County, California, between January 2020 and March 2022, we estimate key parameters and perform stability and bifurcation analyses. Our results consistently indicate endemic states characterized by stable spiral equilibria due to reproduction numbers (R0) exceeding unity across all waves. Additionally, the inclusion of vaccination demonstrates the potential to reduce the effective reproduction number below one, shifting the system towards a stable disease-free equilibrium. Our analysis underscores the critical role of latency periods in shaping epidemic dynamics and highlights actionable insights for public health interventions aimed at COVID-19 control and eventual eradication.

Key Findings, in focus

Seven facets of this paper, analysed and brought into focus by AI.

AI-generated · verify against source Generated Jun 08, 2025
In focus · one-line synthesis

This study provides actionable insights for public health interventions aimed at controlling and eventually eradicating COVID-19 by underscoring the importance of latency periods and vaccination in disease progression.

01
MethodologyHow they did it

The research employs extended SIR and SEIR models, incorporating demographic factors like birth and death rates, to analyze COVID-19 infection dynamics over four epidemic waves in Orange County, California, from January 2020 to March 2022. Stability and bifurcation analyses are performed using empirical data.

02
ResultsWhat they found
  • Reproduction numbers (R0) consistently exceed unity, indicating endemic states with stable spiral equilibria across all analyzed waves.
  • Vaccination is shown to potentially reduce the effective reproduction number below one, shifting the system towards a stable disease-free equilibrium.
  • Latency periods are highlighted as critical in shaping epidemic dynamics.
03
SignificanceWhy it matters

This study provides actionable insights for public health interventions aimed at controlling and eventually eradicating COVID-19 by underscoring the importance of latency periods and vaccination in disease progression.

04
Technical ContributionsWhat's new technically

Enhanced Kermack-McKendrick framework through the integration of demographic factors, providing a more realistic representation of long-term disease progression.

05
NoveltyWhat sets it apart

The paper extends classical SIR models by including birth, death, and vaccination rates, offering new insights into COVID-19 epidemic dynamics and control strategies.

06
LimitationsWhat to be cautious about
  • The study is limited to data from Orange County, California, which may not be fully representative of global COVID-19 dynamics.
  • Model assumptions and simplifications may not capture all complexities of real-world disease transmission.
07
Future WorkWhere it goes next
  • Further investigation into diverse geographical and demographic contexts to validate model applicability.
  • Incorporation of additional factors like waning immunity, variant transmissibility, and behavioral changes in model refinement.

Impact

11
References

Paper Details

Paper ID: 2505.13753
Comments: 17 Pages, 3 figures
Categories:
q-bio.PE math.DS physics.soc-ph

How to Cite This Paper

Reference manager: RIS EndNote

Citation Network

Current paper (gray), citations (green), references (blue)

Display is limited for performance on very large graphs.

Current Paper
Citations
References
Click to view


Discussion 0

This website uses cookies to ensure you get the best experience. Learn more