Analysis of Interpolating Regression Models and the Double Descent Phenomenon
Publication
Metrics
AI Quick Summary
This paper analyzes interpolating regression models and explores the double descent phenomenon, where overparametrized models show improved generalization despite interpolating training data. It provides insights into the behavior of testing error as model complexity increases, explaining the double descent shape through the smallest singular value of the regression matrix.
Paper Preview
Abstract
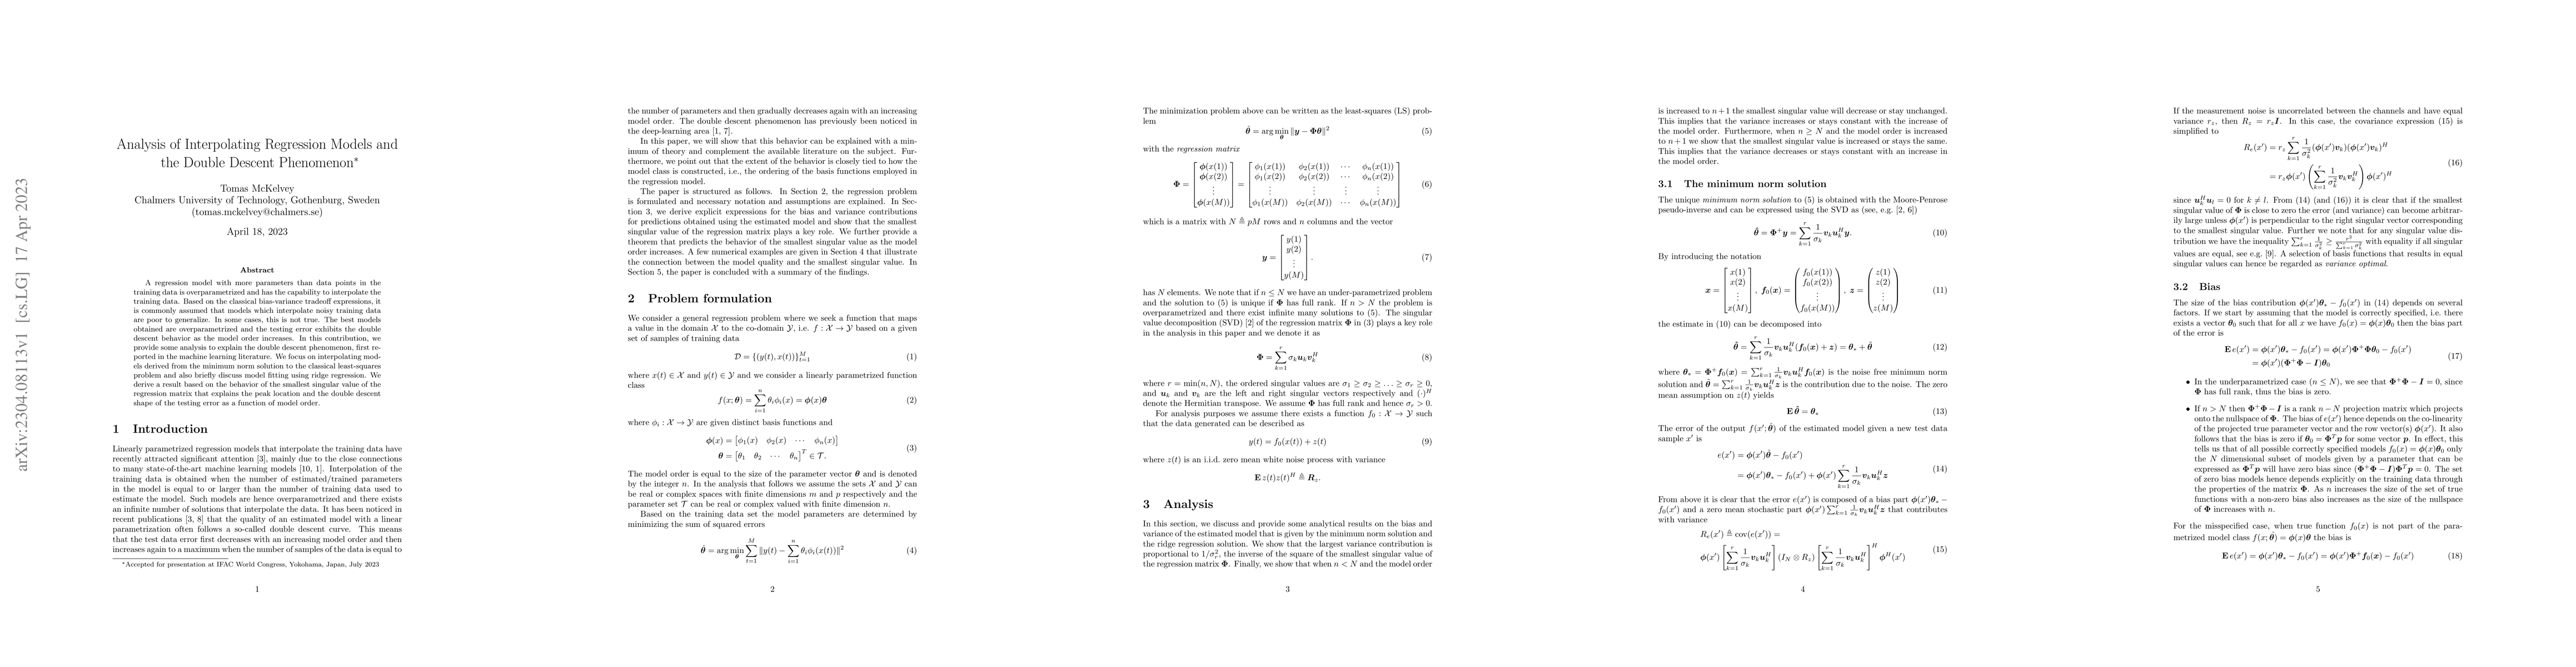
A regression model with more parameters than data points in the training data is overparametrized and has the capability to interpolate the training data. Based on the classical bias-variance tradeoff expressions, it is commonly assumed that models which interpolate noisy training data are poor to generalize. In some cases, this is not true. The best models obtained are overparametrized and the testing error exhibits the double descent behavior as the model order increases. In this contribution, we provide some analysis to explain the double descent phenomenon, first reported in the machine learning literature. We focus on interpolating models derived from the minimum norm solution to the classical least-squares problem and also briefly discuss model fitting using ridge regression. We derive a result based on the behavior of the smallest singular value of the regression matrix that explains the peak location and the double descent shape of the testing error as a function of model order.
AI Key Findings
Get AI-generated insights about this paper's methodology, results, significance, and more — seven facets brought into focus.
Impact
Paper Details
Authors
PDF Preview
Key Terms
Citation Network
Current paper (gray), citations (green), references (blue)
Display is limited for performance on very large graphs.
Discussion 0